The COVID-19 pandemic has ended the 11-year bull market, and stock prices have dropped precipitously. These are troubling times, but Trouble is Opportunity. Many high-quality dividend growth stocks that traded at premium valuations just two months ago are available at discounts now!
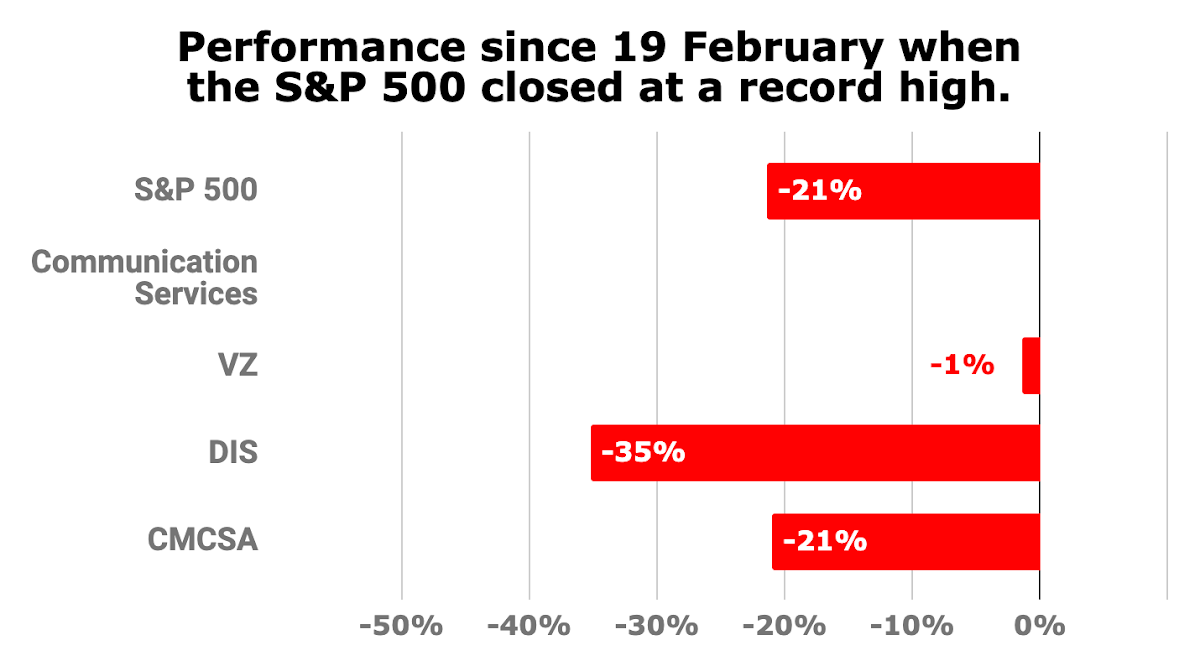
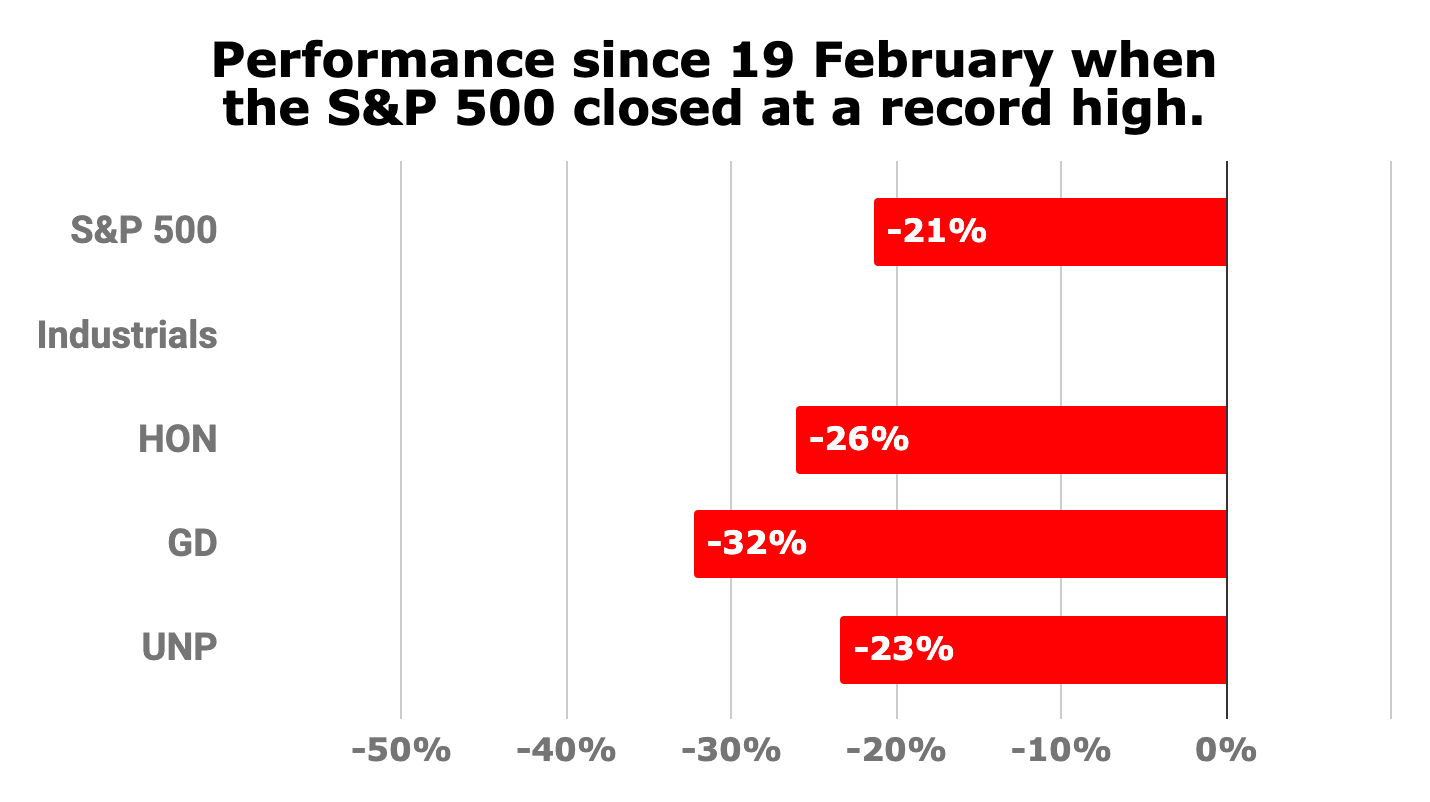
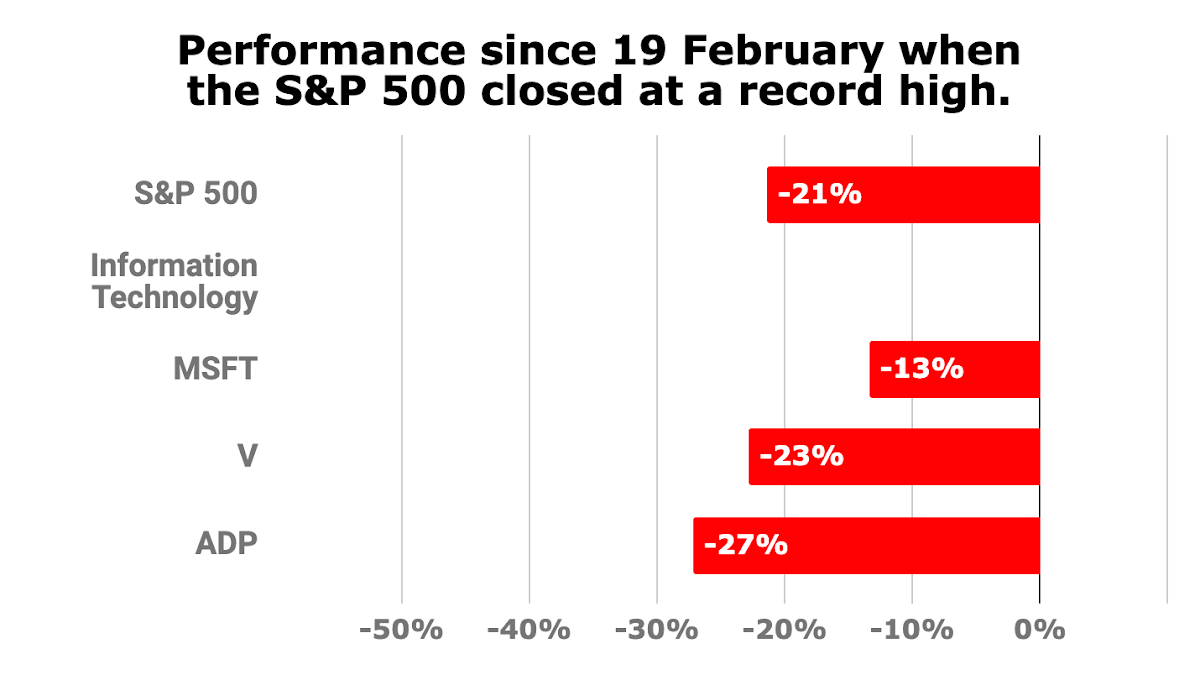
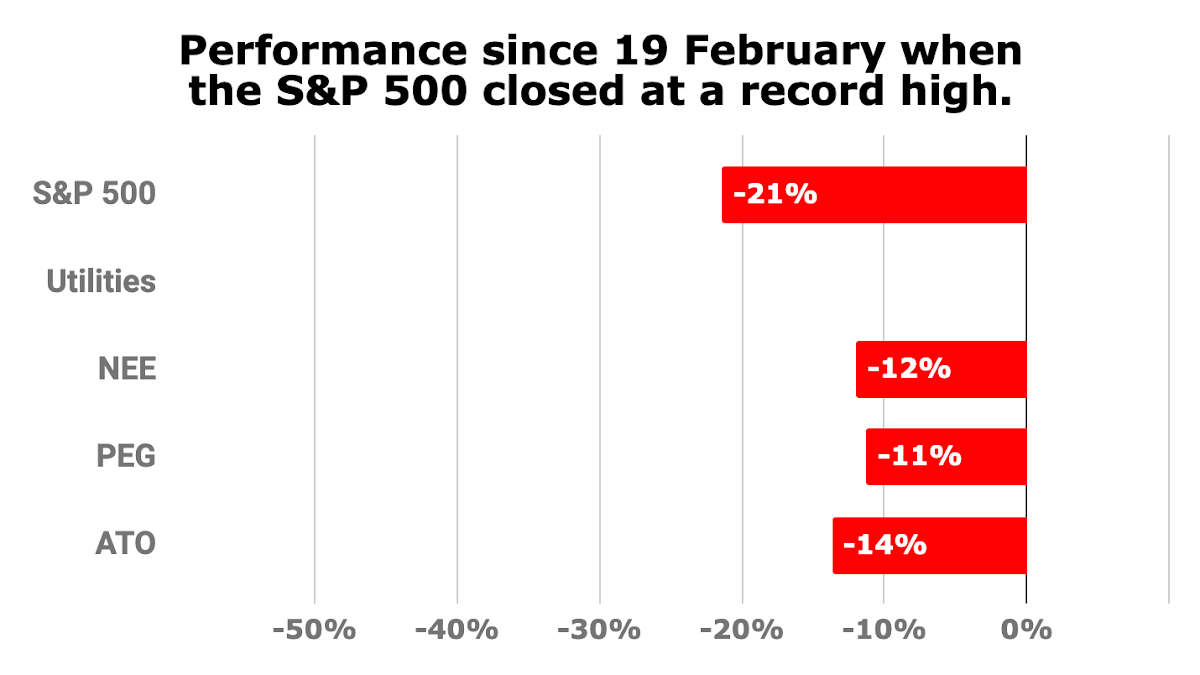
This article presents the three top-ranked dividend growth stocks in each of the GICS sectors. For each stock, I provide quality indicators, key metrics, and fair value estimates. I also provide charts showing how each of these stocks performed since February 19, when the S&P 500 closed at an all-time high of 3,386.15.
I consider dividend growth stocks to be stocks with increasing dividend payouts in each of the past five years. The Dividend Champions list covers such stocks listed on U.S. exchanges.
To rank dividend growth stocks, I sort them by decreasing quality scores as determined by DVK Quality Snapshots. The system assigns quality scores by employing five quality indicators and assigning 0-5 points to each quality indicator, for a maximum of 25 points. To break ties, I compare up to three additional metrics, in turn.
Ranking Stocks
DVK Quality Snapshots provide an elegant and effective way to assess the quality of dividend stocks. I use the scoring system as presented by DVK but use my own systems to rate and rank dividend stocks.
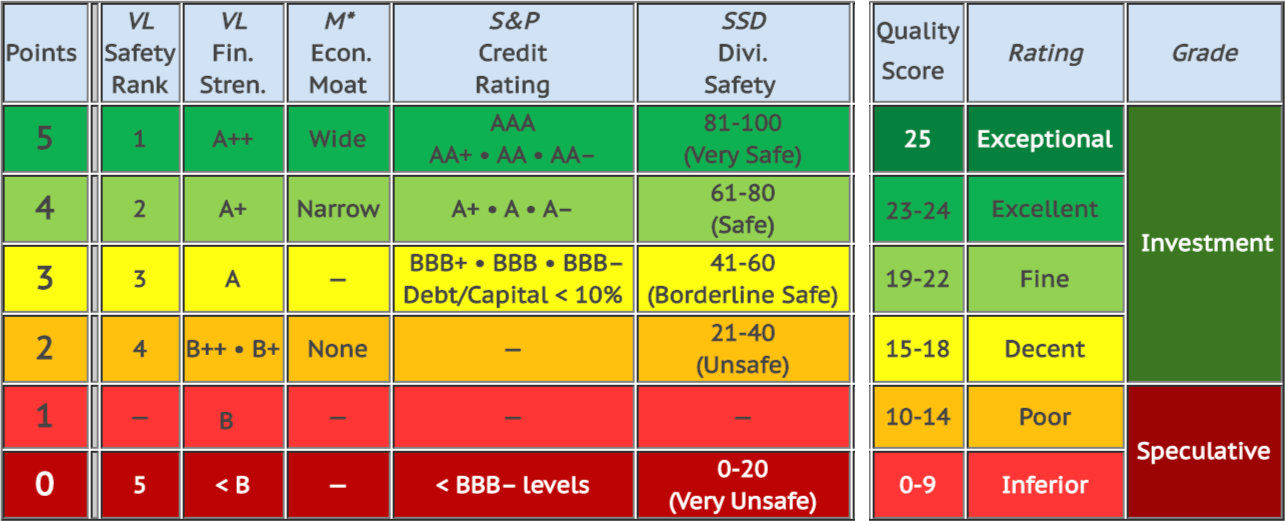
DVK Quality Snapshots scoring system and my rating system |
My rating system maps to different quality score ranges. Ratings are Exceptional (25), Excellent (23-24), Fine (19-22), Decent (15-18), Poor (10-14), and Inferior (0-9). Furthermore, Investment Grade ratings correspond to quality scores in the range 15-25, while Speculative Grade ratings have quality scores below 15 points.
To rank stocks, I need a way to break ties between stocks with the same quality score, so I consider the following factors in turn:
- SSD Dividend Safety Scores
- S&P Credit Ratings
- Dividend Yield
When two stocks with the same quality score have the same Dividend Safety Score, I next compare their S&P Credit Ratings, ranking the one with the better Credit Rating higher. I rarely need to break ties with Dividend Yield.
Key Metrics and Fair Value Estimates
In each table below, I present key metrics of interest to dividend growth investors, along with quality indicators and fair value estimates. These including the years of consecutive dividend increases (Yrs), the dividend Yield for a recent Price, and the 5-year compound annual dividend growth rate (5-Yr. DGR).
I provide fair value estimates (Fair Val.) to help identify stocks that trade at favorable valuations. The last column shows the discount (Disc.) or premium (Prem.) of the recent price to my fair value estimate.
To estimate fair value, I reference fair value estimates and price targets from several sources, including Morningstar and Finbox.io. Additionally, I estimate fair value using the 5-year average dividend yield of each stock using data from Simply Safe Dividends.
With several estimates and targets available, I ignore the outliers (the lowest and highest values) and use the average of the median and mean of the remaining values as my fair value estimate.
The table includes a column for the Chowder Number (CDN), a popular metric for screening dividend growth stocks for possible investment. The metric favors dividend growth stocks likely to produce annualized returns of at least 8%. The CDN column is color-coded to indicate the likelihood of delivering annualized returns of at least 8%. Green means likely, yellow means less likely, and red means unlikely. I consider green CDNs favorable.
Finally, the CCC column indicates membership of the Dividend Champions list, and stocks I own are highlighted in the Ticker column.
1. Communication Services

|
|
I own all three of these Communication Services sector stocks in my DivGro portfolio.
I consider a full position in my portfolio to be about 1% of the total value of my portfolio. This is somewhat arbitrary and would imply a portfolio of 100 equal-sized positions. I do own 90 different positions, but some are quite large (3.24%, and many are well below 1% of the total value of my portfolio).
My VZ position (69 shares short of a full position) and my CMCSA position (-56 shares) are not full positions, whereas my DIS position (+107 shares) is substantially larger than a full position.
Possible Trades
VZ's low CDN makes it unlikely that the stock will return at least 8% annually, so I'm not interested in adding shares at this time. As for DIS, while the company is experiencing some extraordinary challenges due to the COVID-19 pandemic, I'm holding onto all my shares. I believe the company will be fine in the long run.
Given CMCSA's discount valuation of about 22% and its favorable CDN, I'm interested in turning my CMCSA position into a full position. To do so, I would need to add at least 56 shares.
Here is a F.A.S.T. Graphs chart for CMCSA. In these charts, the black line represents the share price and the blue line represents the calculated P/E multiple at which the market has tended to value the stock over time. The orange line is the primary valuation reference line. It is based on one of three valuation formulas depending on the earnings growth rate achieved over the time frame in question. (The Adjusted Earnings Growth Rate represents the slope of the orange line in the chart.)
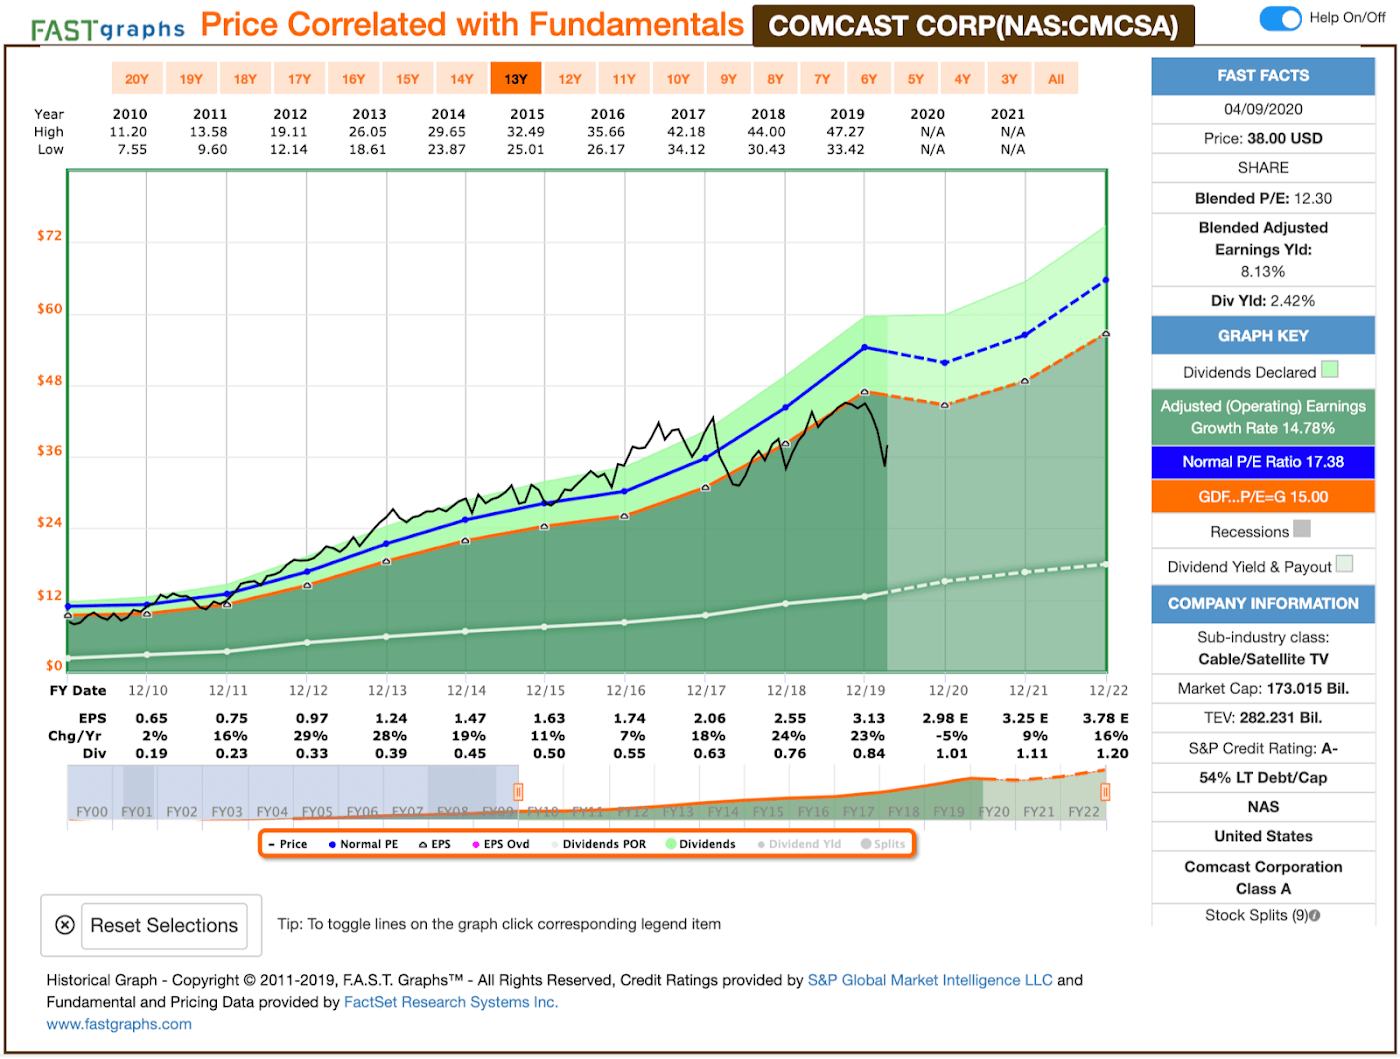
CMCSA's price line is below the primary valuation line and below the stock's normal P/E ratio, so the chart confirms my discounted valuation. An investment in CMCSA in January 2010 would have returned 17.1% on an annualized basis (with dividends included). In comparison, the S&P returned 10.8% over the same period.
2. Consumer Discretionary

|
|

I own all three of these Consumer Discretionary sector stocks in my portfolio.
My NKE (-97 shares) and MCD (-26) positions are not yet full positions, whereas my HD position (+12) is larger than a full position by about 12 shares.
Possible Trades
Of these stocks, I'm only interested in NKE at this time. Given its perfect quality score of 25, I rate NKE Exceptional. While its CDN is not quite favorable and the stock trades at about fair value, I'm thinking about adding shares and making NKE a full position in my portfolio.
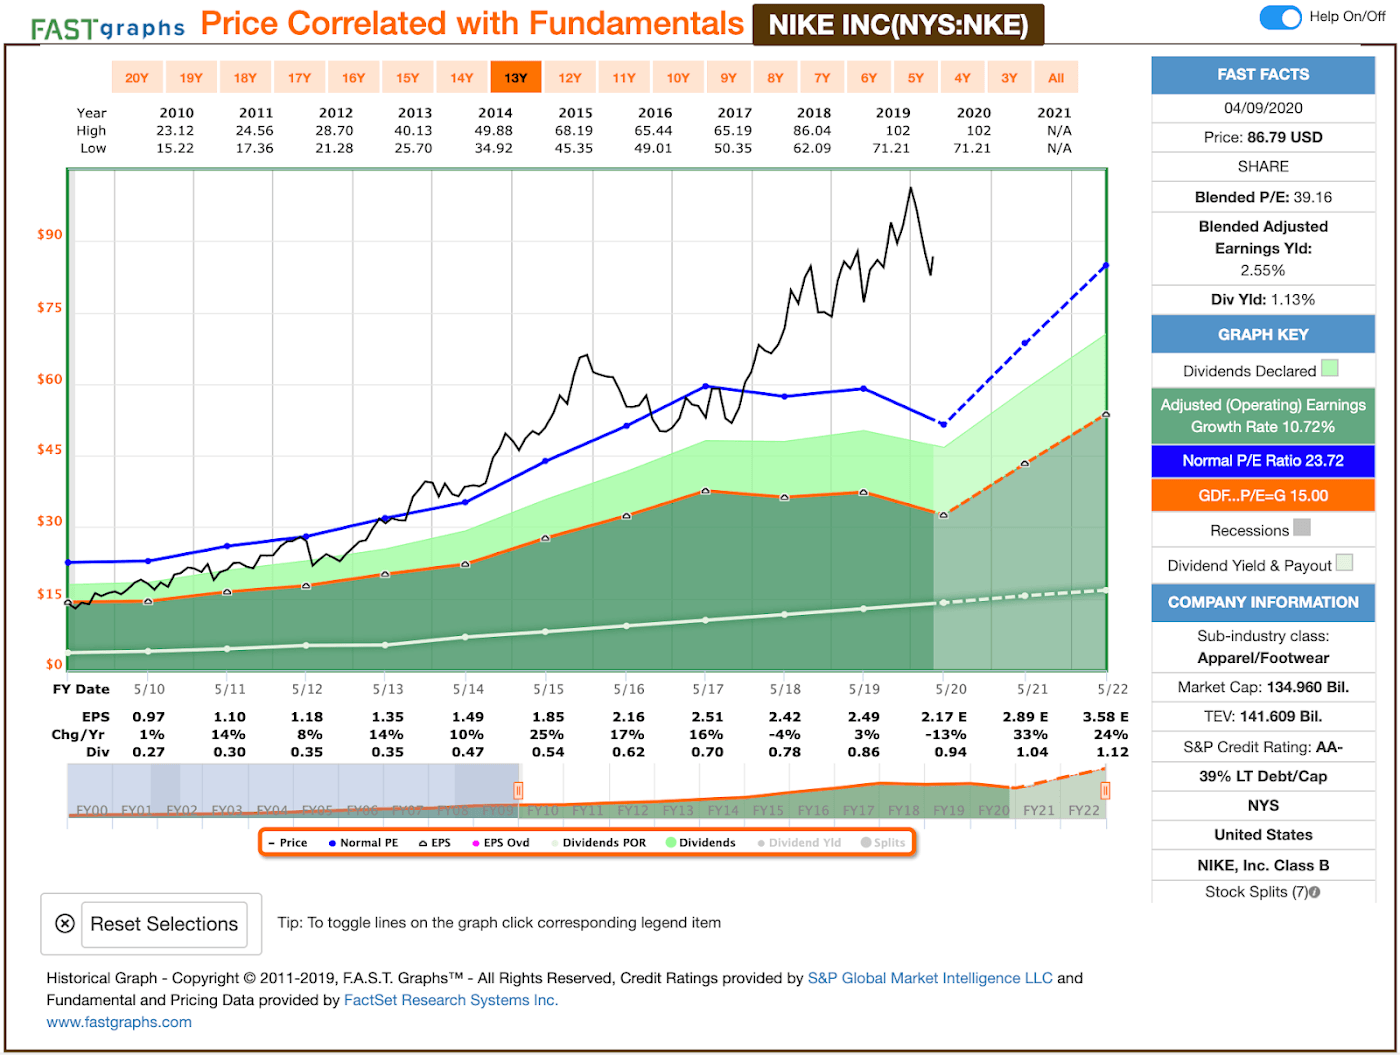
NKE's price line is above the primary valuation line and above the stock's normal P/E ratio, so the stock appears to be trading at a premium to fair value. While this appears to contradict my valuation, note that my fair value estimate also accounts for future growth potential. And it appears that earnings and growth estimates (represented by the dashed lines in the F.A.S.T. Graphs chart) confirm that potential.
An investment in NKE in June 2010 would have returned 18% on an annualized basis (with dividends included). In comparison, the S&P returned 11.5% over the same period.
3. Consumer Staples
|
|
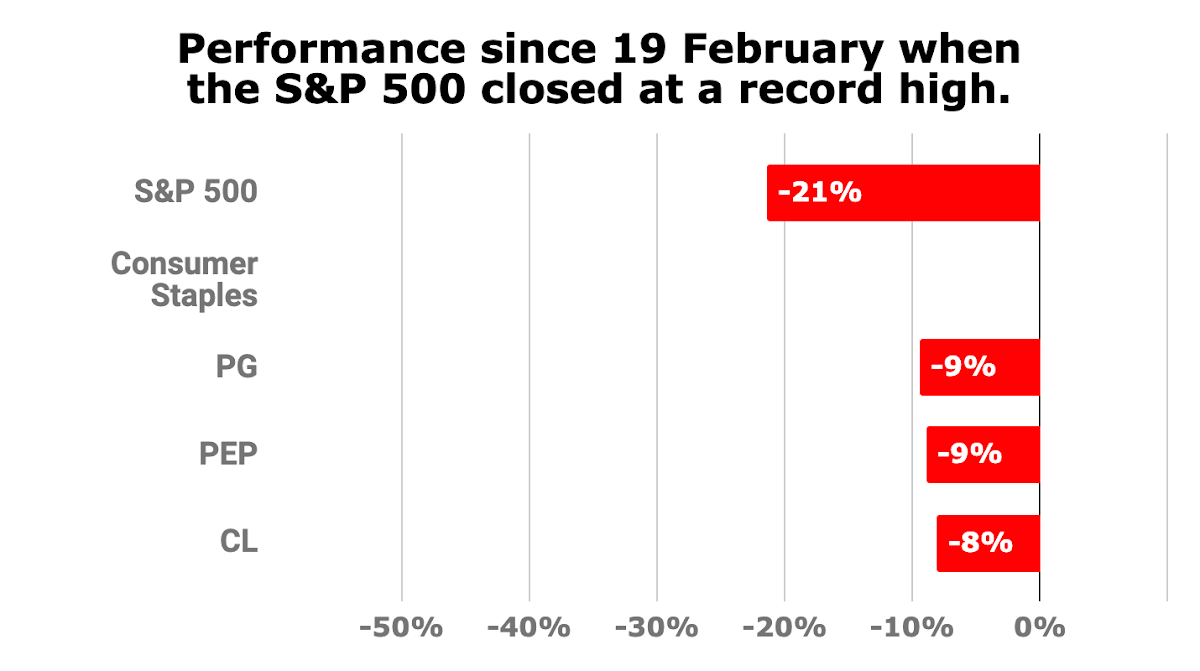
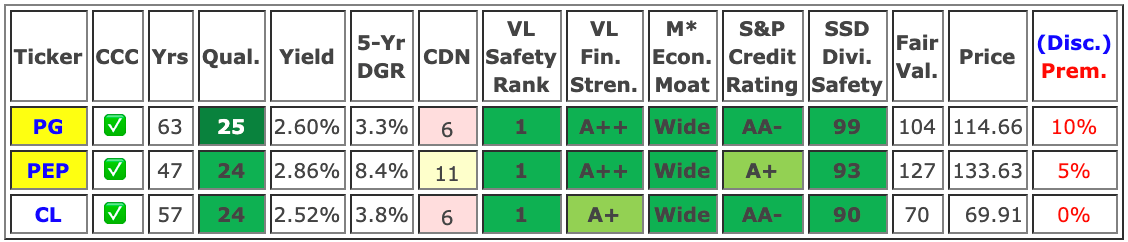
I own two of these Consumer Staples sector stocks in my portfolio.
Both my PG (-60 shares) and PEP (-53) positions are not yet full positions.
Possible Trades
Although PEP is trading at a small premium to fair value and its CDN is not favorable, I'm thinking about adding at least 53 shares and making it a full position. PEP is a high-quality stock, and I'm willing to pay a bit of a premium to increase my ownership.
While PG and CL also are high-quality stocks, rated Exceptional and Excellent respectively, their CDNs are just not compelling enough. This year, I'm focusing on improving my portfolio's growth prospects, and I use the CDN as a guiding metric.
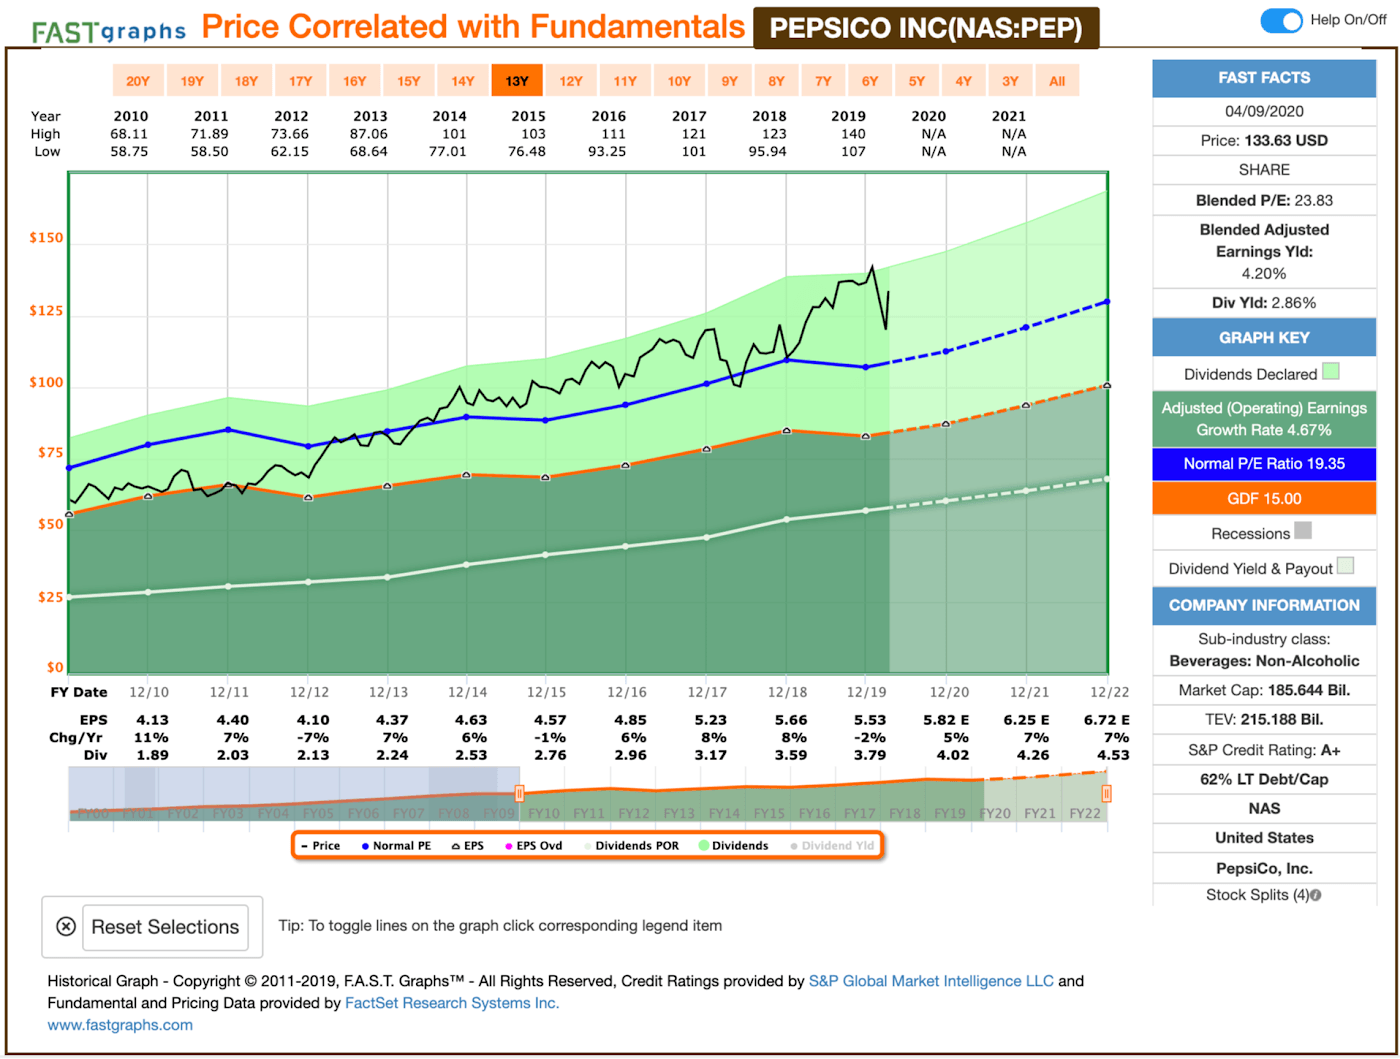
PEP's price line is above the primary valuation line and above the stock's normal P/E ratio, so the stock is trading at a premium to fair value, confirming my valuation.
An investment in PEP in January 2010 would have returned 9.9% on an annualized basis (with dividends included). In comparison, the S&P returned 10.8% over the same period.
4. Energy

|
|
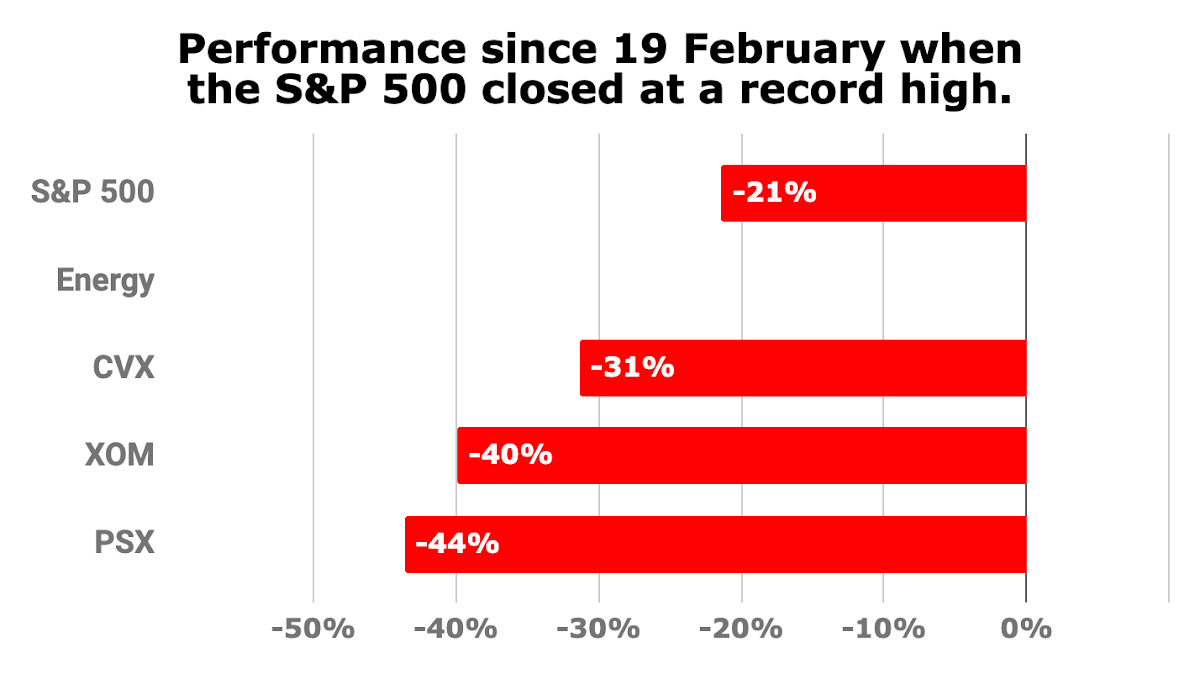
I own all three of these Energy sector stocks, all of which are trading well below my fair value estimates.
My CVX (-35 shares) and XOM (-20) positions are not yet full positions, whereas my PSX (+42) position is larger than a full position by about 42 shares.
Possible Trades
Both CVX and XOM present interesting opportunities, especially given their compelling yields:
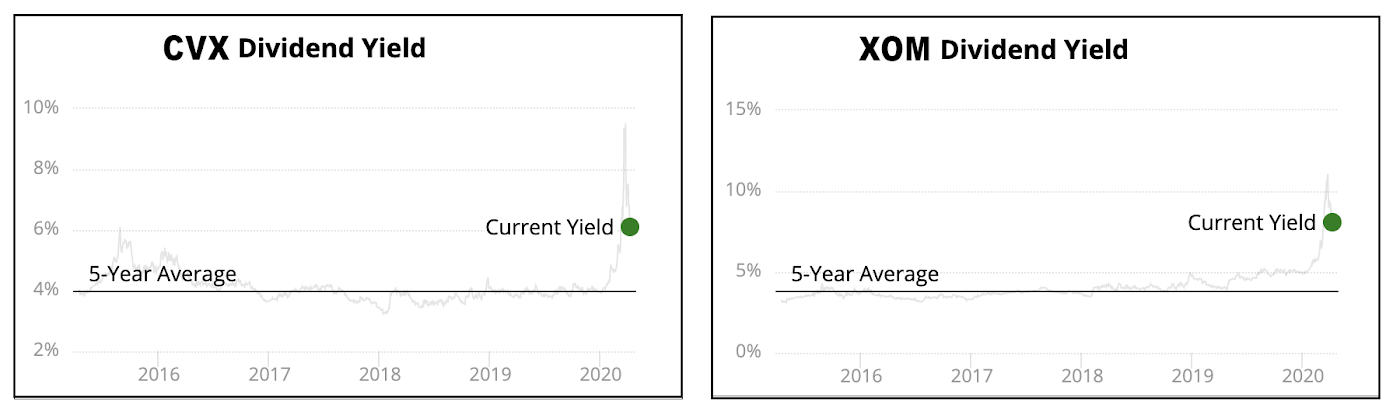
Source: Simply Safe Dividends
The question is, how safe are their dividends? According to Simply Safe Dividends, CVX's dividend is Safe and XOM's dividend is Borderline Safe. However, both companies are taking cost-cutting measures in an effort to protect their dividends.
So, I'm considering turning my CVX and XOM positions into full positions. To do so, I would need to add 35 shares of CVX and 20 shares of XOM. In doing so, I'll reduce my average cost basis and improve my average yield on cost for both positions.
5. Financials
|
|
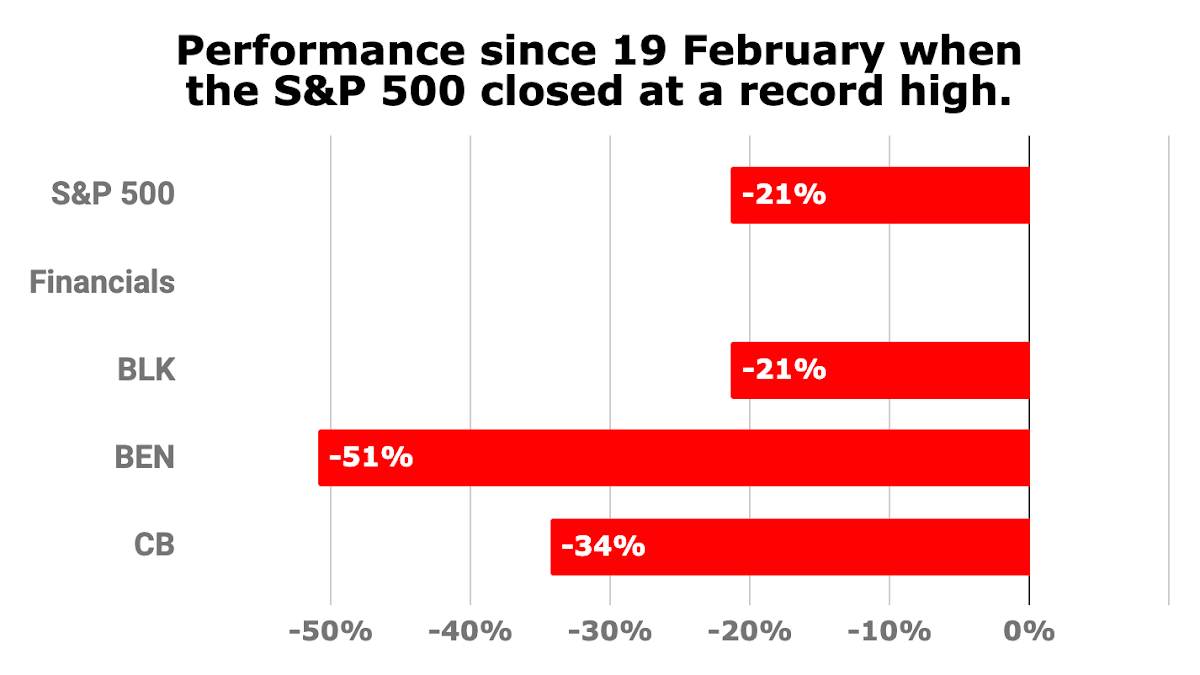
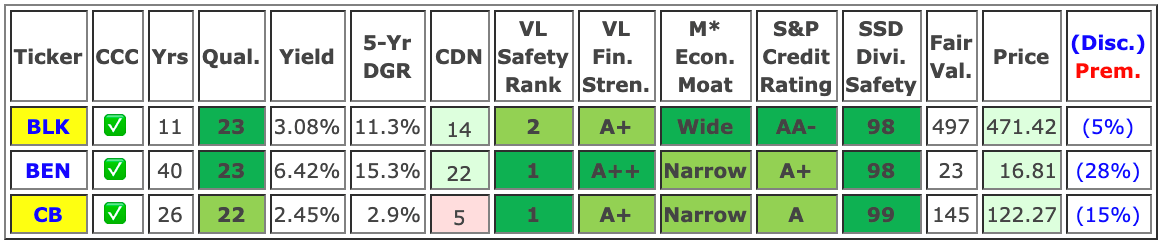
I own two of these Financials sector stocks, which are now trading at discount valuations.
My BLK (+14 shares) position is about twice the size of a full position. On the other hand, my CB (-56 shares) position is relatively small.
Possible Trades
I'm not looking to expand my BLK position here, and CB's CDN gives me pause, despite its discounted valuation. BEN looks interesting, though. Having lost more than half its value in just two months, I'm somewhat intrigued. Perhaps it is time to open a position!
The stock now offers a compelling yield, and it still carries a Very Safe dividend safety rating from Simply Safe Dividends.
Source: Simply Safe Dividends
In February, Franklin Resources announced that it will acquire Legg Mason (LM) for $50.00 per share of common stock in an all-cash transaction. The acquisition will more than double BEN's assets under management and allow the company to leverage synergies.
As for BEN, the company is facing serious headwinds due to a secular trend away from higher-cost, active funds to lower-cost, passive funds, such as index mutual funds and ETFs. The company's assets under management (AUM) are declining, so its ability to continue strong dividend growth may be impaired. I'm not interested in opening a position unless BEN can find a way to consistently grow its AUM again.
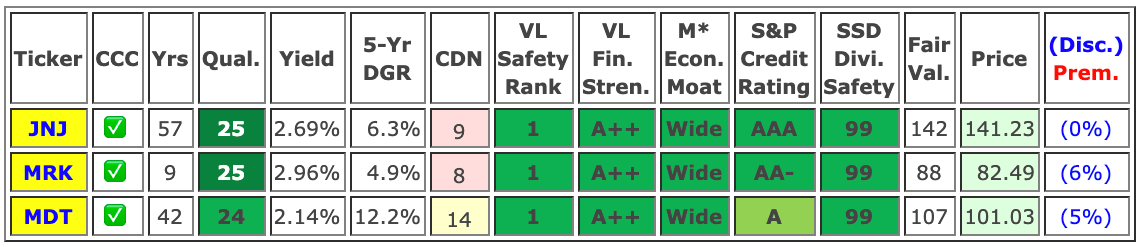
6. Health Care
|
|
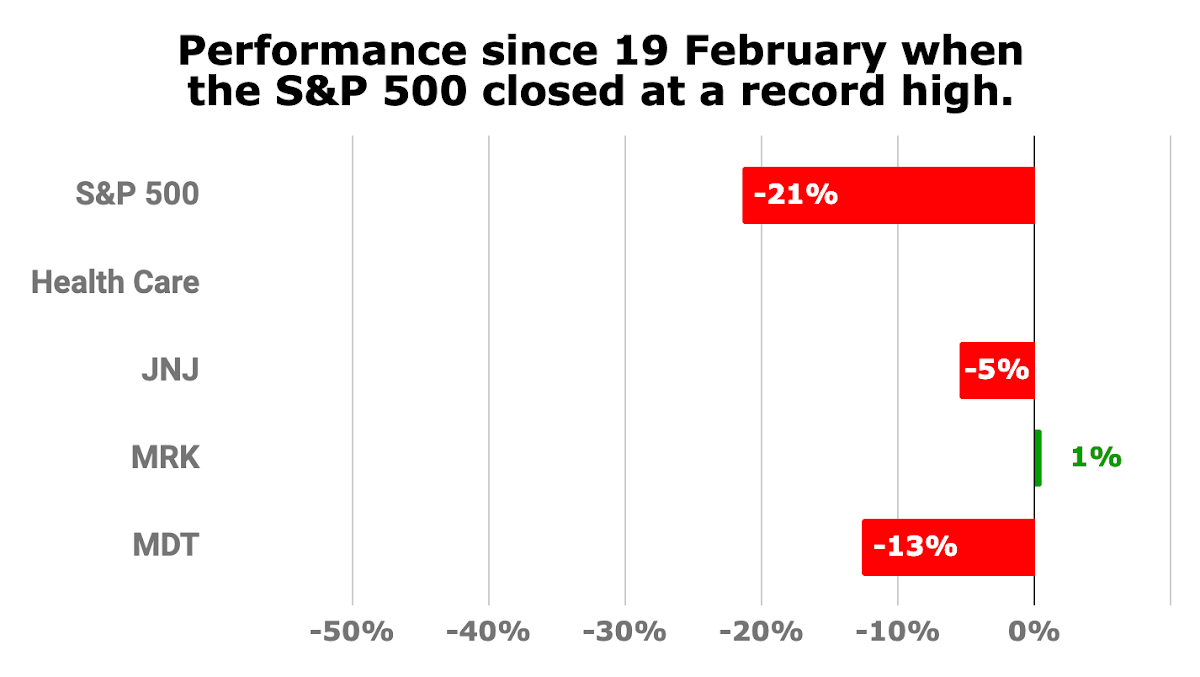
I own all three of these Health Care sector stocks in my portfolio.
My JNJ (-45 shares) and MRK (-8 shares) positions are not yet full positions, but my MDT position essentially is a full position.
Possible Trades
Given their CDNs, I'm not really interested in adding shares to my JNJ and MRK positions. These are exceptional stocks, though, so readers may want to take a look at them. Furthermore, since MDT already is a full position in my portfolio, I won't be adding MDT shares either.
7. Industrials

 |
|
I own all three of these Industrials sector stocks in my portfolio.
All three positions are not yet full positions. To turn them into full positions, I would need to add 8 shares to HON, 19 shares to GD, and 17 shares to UNP.
Possible Trades
In my view, all three stocks are suitable for further investment, but GD looks the most compelling at a discount of 24% to my fair value estimate.
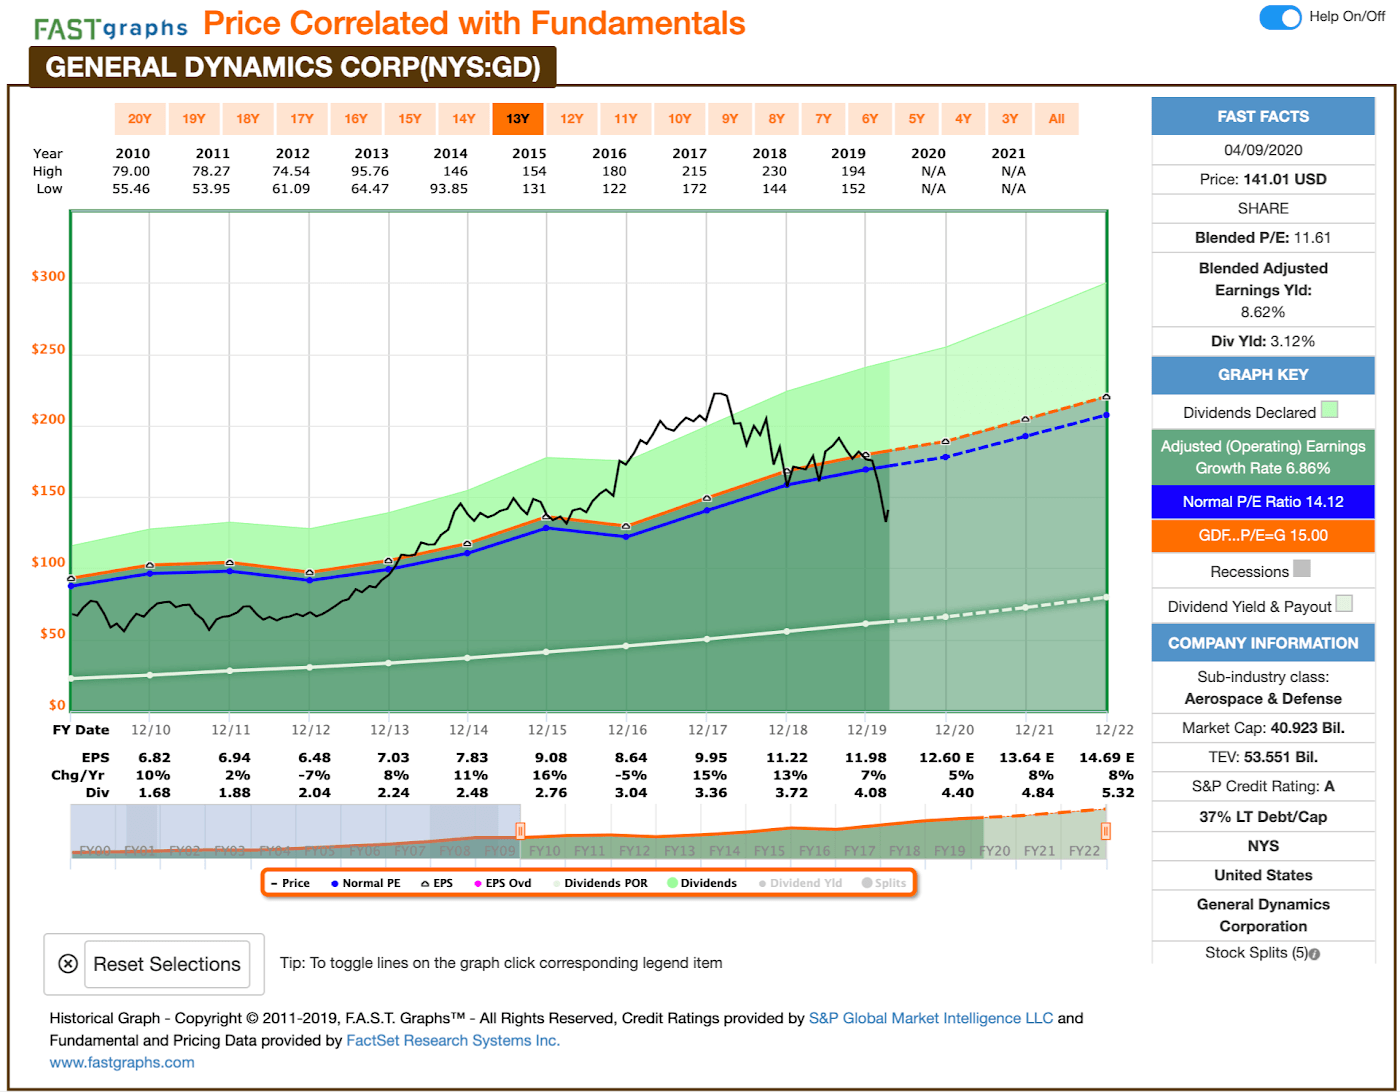
GD's price line is below the primary valuation line and below the stock's normal P/E ratio, so the stock is trading at a discount to fair value, confirming my valuation.
An investment in GD in January 2010 would have returned 9.2% on an annualized basis (with dividends included), while the S&P 500 returned 10.8% over the same period.
8. Information Technology
|
|
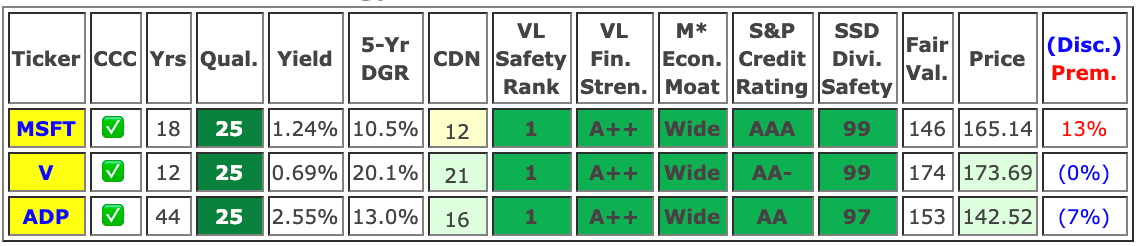
I own all three of these Information Technology sector stocks in my portfolio.
My ADP (-8 shares) and V (-6 shares) positions are not yet full positions, but my MSFT (+45 shares) is about twice the size of a full position.
Possible Trades
Based on their CDNs, both V and ADP appear to be suitable candidates for further investment. However, I'm already heavily invested in this sector, so I'll favor ADP for the better discount it offers.
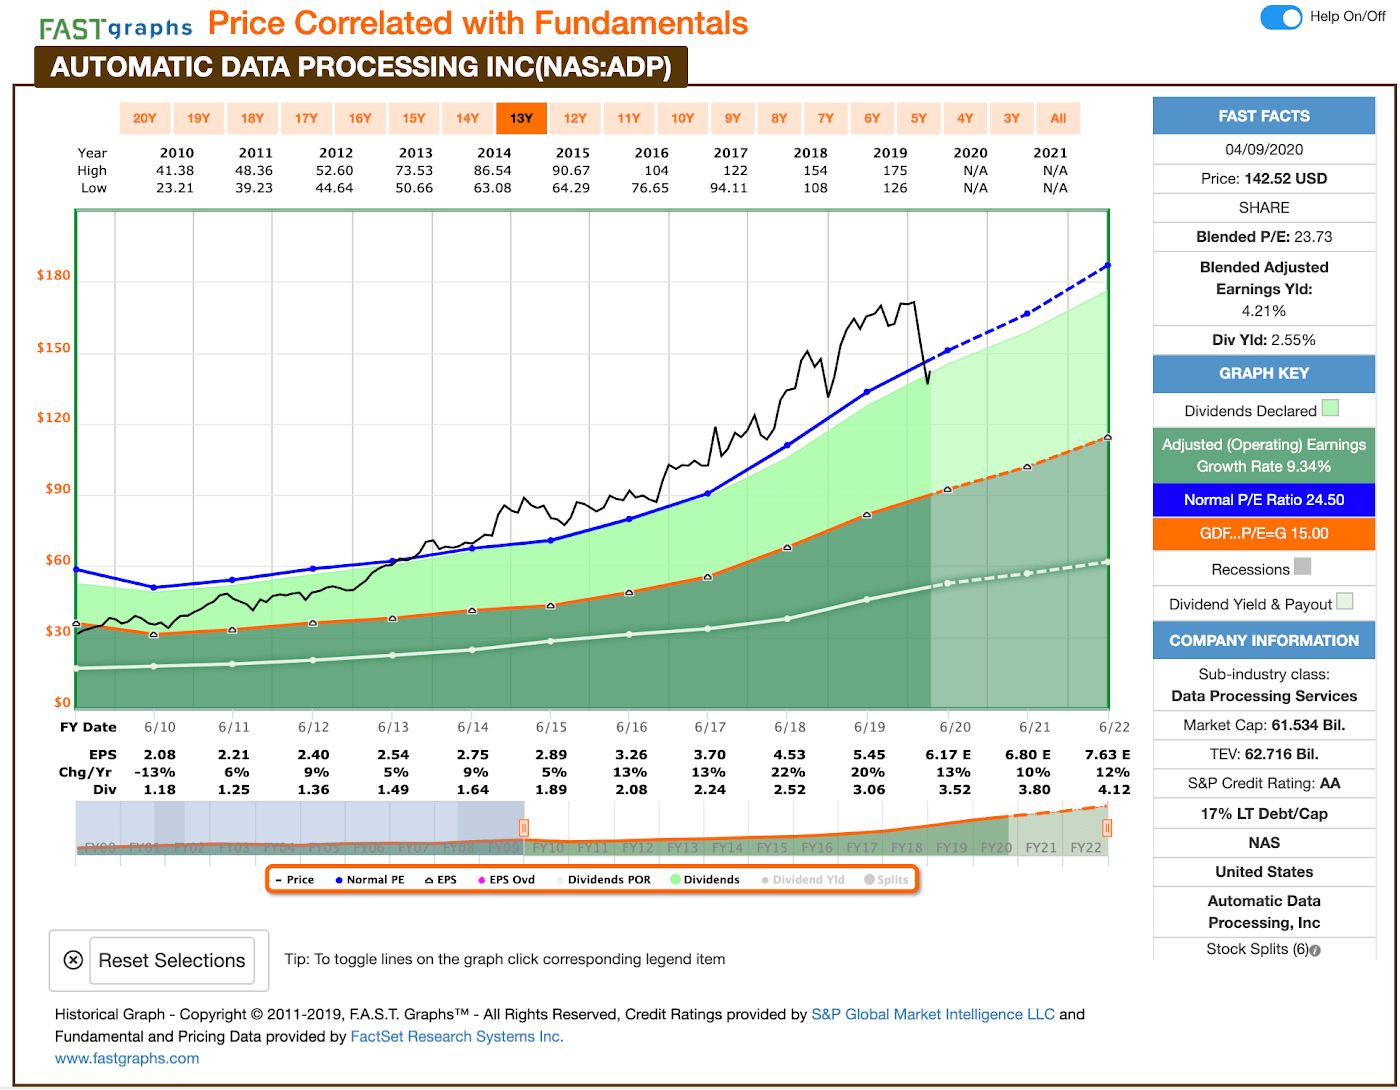
ADP's price line is below the primary valuation line and below the stock's normal P/E ratio, so the stock is trading at a discount to fair value, confirming my valuation.
An investment in ADP in July 2010 would have returned 16.8% on an annualized basis (with dividends included), compared with a return of 12.2% by the S&P 500 over the same period.
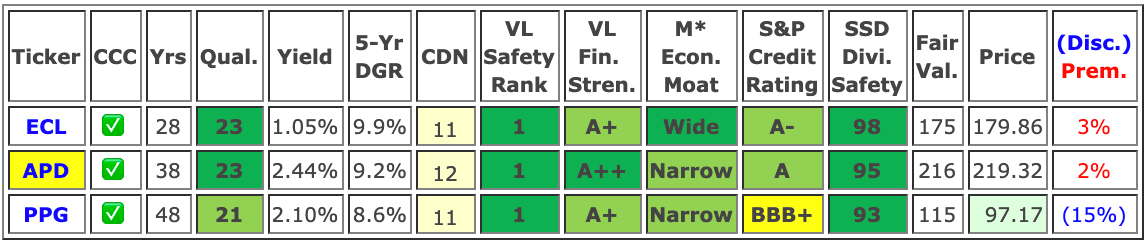
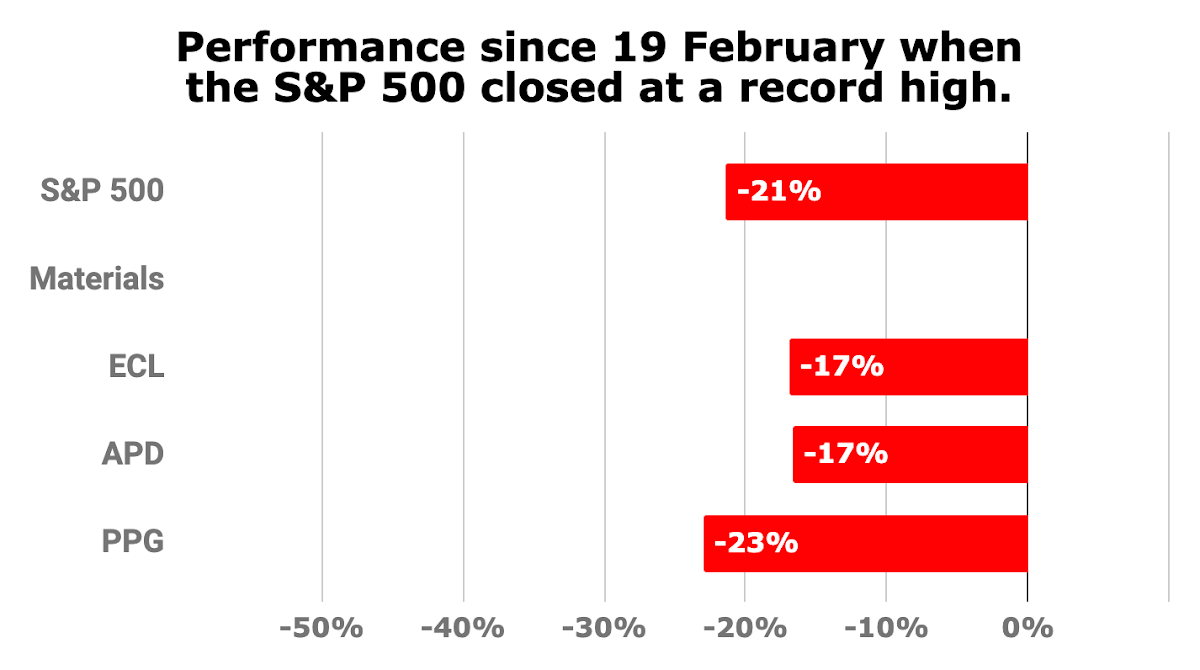
9. Materials
|
|
I own only one of these Materials sector stocks in my portfolio. In fact, APD is the only Materials sector stock I own. It is a relatively small position, and I would need to add 28 shares to make it a full position.
Possible Trades
With APD trading a little above fair value, I'm not really looking to add shares at this time. Besides, it's CDN is not favorable.
I would love to add another Materials sector stock to my DivGro portfolio, but neither of the other candidates offers compelling CDNs. My search for another Materials sector continues!
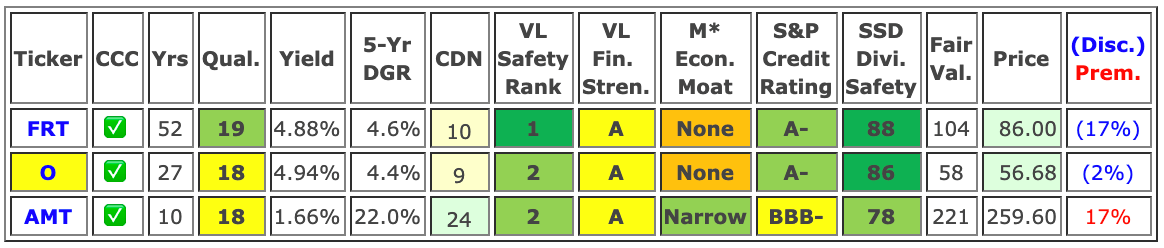
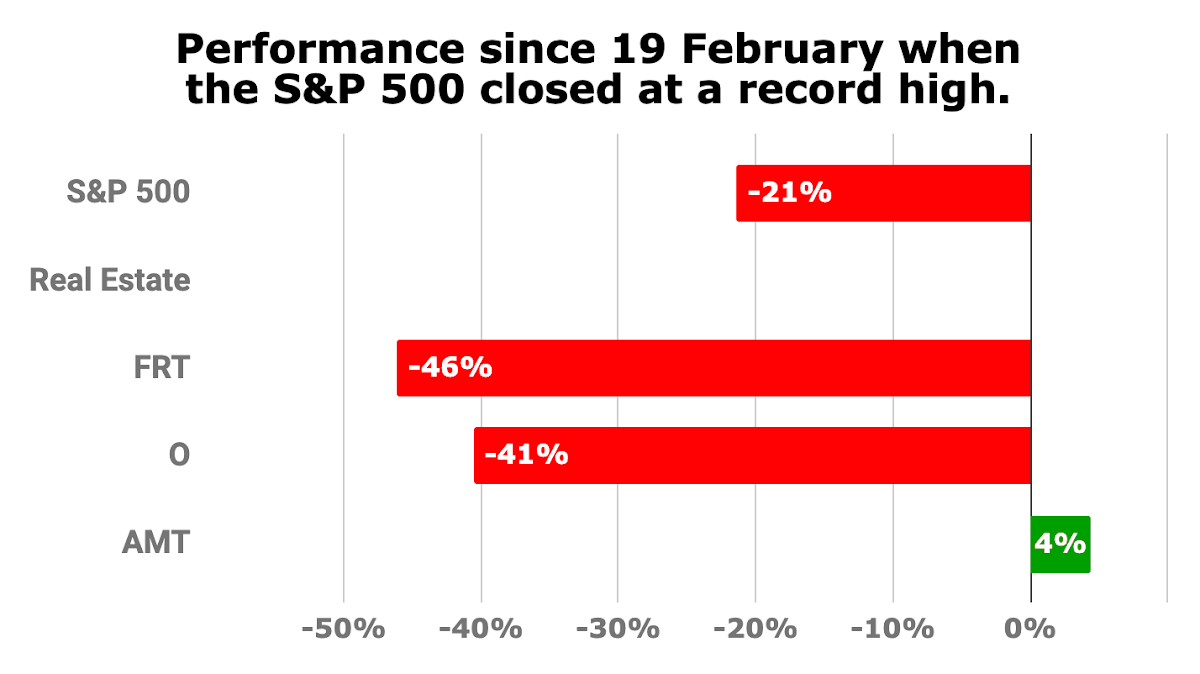
10. Real Estate
|
|
I own only one of these Real Estate sector stocks in my portfolio, O, and it is a very small position presently. I reduced my position in June 2019 when the stock hit $70 per share, selling 200 of 250 shares. To establish a full position, I would need to add at least 122 shares.
Possible Trades
AMT looks interesting from a growth perspective, but the stock is trading well above fair value. Notice that it is one of only two stocks in this article showing positive returns since February 19!
I'm considering reinstating a full position in O, although I'd like to do so at a lower entry point and a dividend yield of at least 6%. Given O's annual dividend rate of $2.80, that means the price would need to drop to about $46 per share.
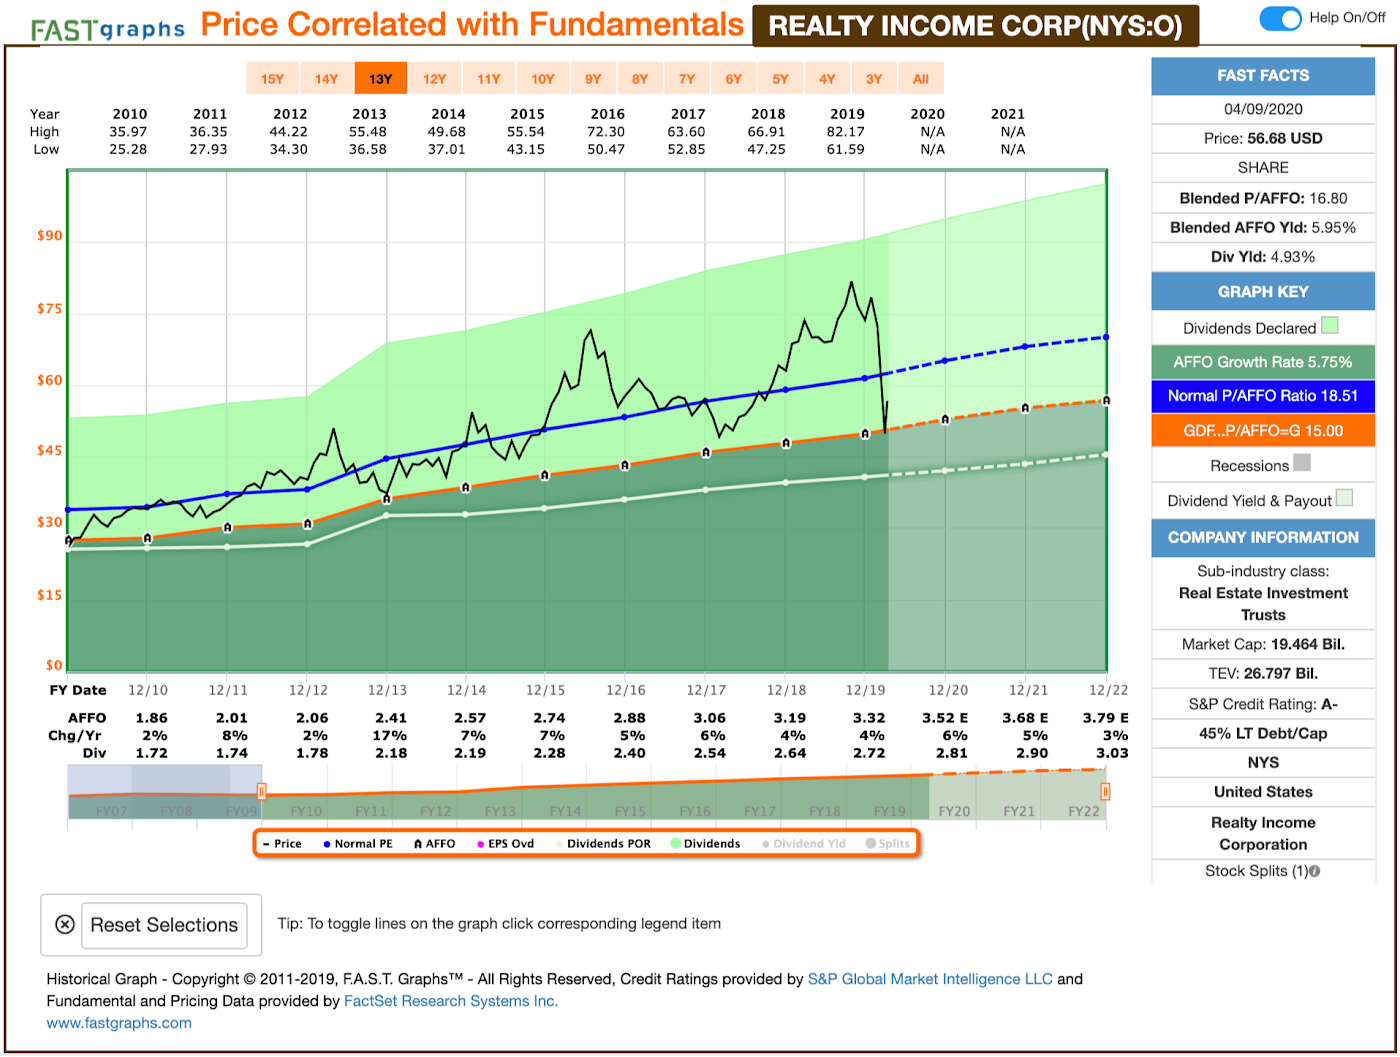
O's price line is below the primary valuation line and below the stock's normal P/AFFO ratio, so the stock is trading at a discount to fair value, confirming my valuation.
An investment in O in July 2010 would have returned 11.4% on an annualized basis (with dividends included), compared with a return of 10.8% by the S&P 500 over the same period.
11. Utilities
|
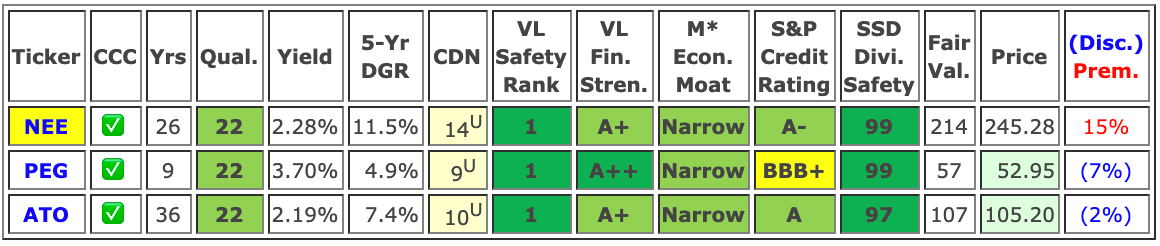
|
I own only one of these Utilities sector stocks, NEE, though it is a relatively small position. I would need to add about 15 shares to make it a full position.
Possible Trades
These are solid stocks with Very Safe dividends, but none of them have favorable CDNs. Unfortunately, NEE is not yet trading at a compelling enough price to consider adding shares to my position.
Concluding Remarks
Concerns about the impact of the COVID-19 pandemic have caused stock prices to drop and ended the 11-year bull market. But troubling times create opportunities, and many high-quality dividend growth stocks that traded at premium valuations just two months ago now are available at discounted valuations.
This article showcased the three top-ranked stocks in each GICS sector along with key ratings and metrics. I presented F.A.S.T. Graphs charts for a selection of these stocks. I own 25 of the 33 stocks and highlighted several candidates for further investment.
I hope this article will give dividend growth investors a good starting point for stock selection and further research, and especially for those looking to build a diversified portfolio.
As always, I encourage you to do your own due diligence before investing.
Thanks for reading, and happy investing!
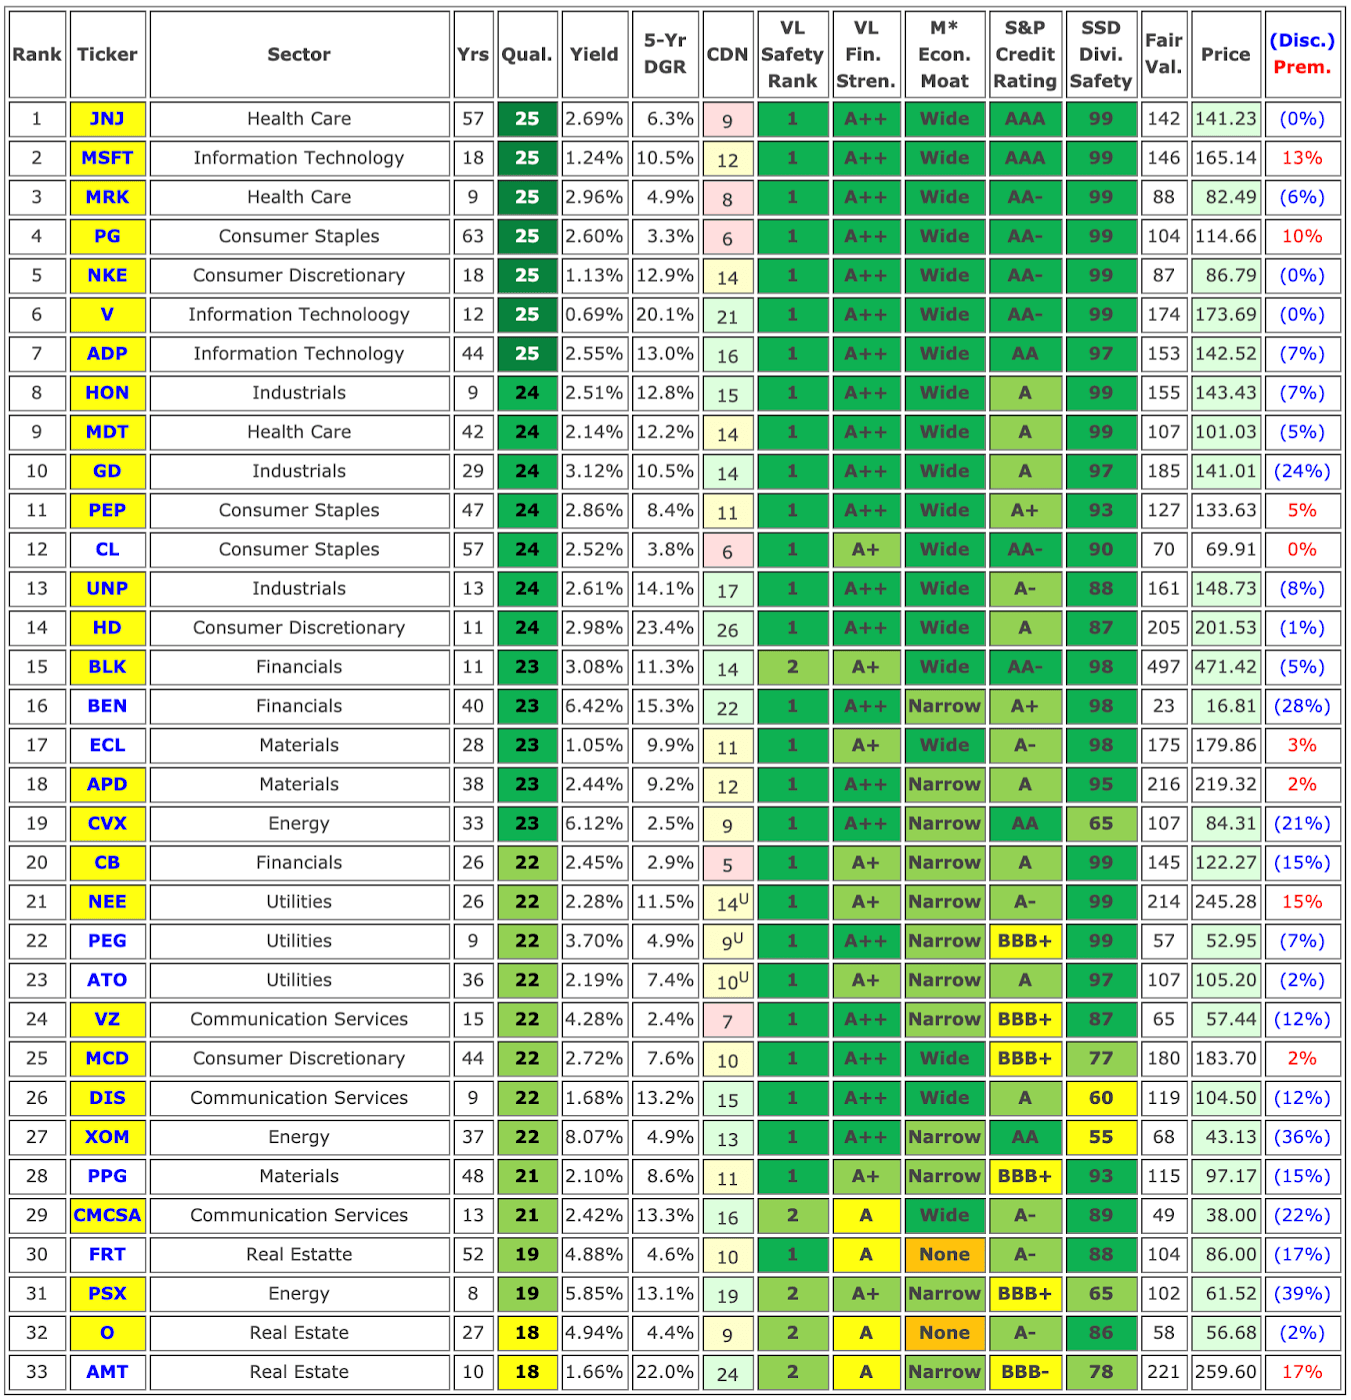
Bonus Section
Below is a table presenting the stocks in this article in rank order. Generally, the Health Care and Information Technology sectors have the highest rankings, while the Real Estate sector has the lowest rankings.