In my ongoing series on "7 Ways to Beat the Market", I have suggested that dividend growth - along with size, value, low volatility, equal-weighting, quality, and momentum - are simple and easy-to-implement factor tilts or alternative weighting schema that can boost performance. By tilting allocations away from the traditional capitalization weights that own more of the stocks that have increased in capitalization, average investors can boost portfolio returns.
Historical Performance
While in the first three articles in the update of this series we looked at very long-term data series from Professor French, for dividend growth I have relied on a thirty year history of the S&P 500 Dividend Aristocrat Index. From the graph below, one can see that the S&P 500 Dividend Aristocrats (BATS:NOBL), components of the S&P 500 that have paid increasing dividends for at least 25 years, have outperformed the broad market by almost 2% per year for the last three decades.
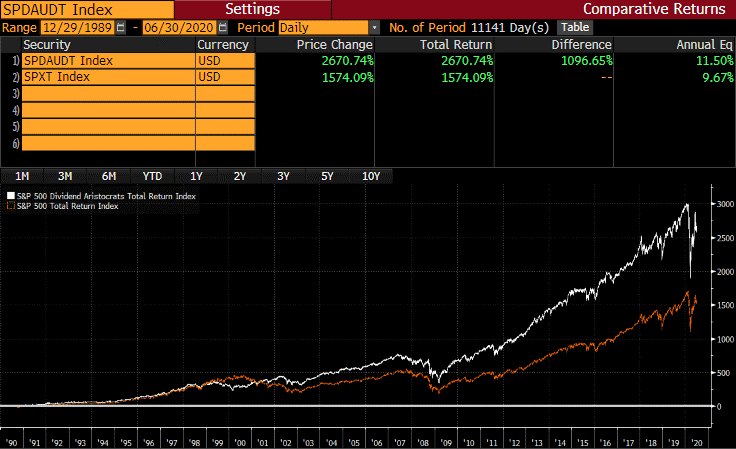 Source: Bloomberg
That long-run outperformance has tended to occur in weak market environments. By splitting each calendar year since 1990 into "up markets" and "down markets" based on the performance of the S&P 500 (SPY), we can illustrate how the Dividend Aristocrats do in different market environments.
In the six down years in this sample period, the Dividend Aristocrats have meaningfully outperformed, besting the S&P 500 in all 6 by an average of 13.4% per year.
In the twenty-four up years in the sample period, the Dividend Aristocrats have kept pace, lagging by only 0.3% per year.
Performance in 2020
With that history, one might have expected that the Dividend Aristocrats would have been outperforming in 2020. That has not been the case. Below is a graph of the Dividend Aristocrat Index and the broader S&P 500 over the first half of 2020.
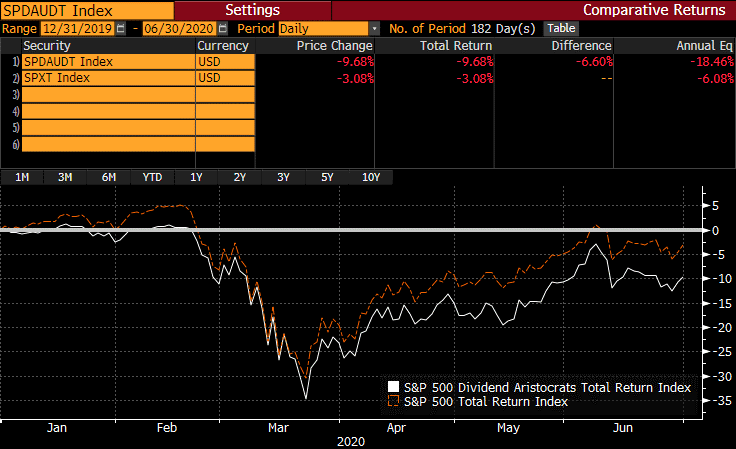 Source: Bloomberg