Automatic Data Processing: Investment Thesis
In my article of May 22, 2020, I wrote,
Automatic Data Processing (NASDAQ:ADP) is a sell at its present share price. High unemployment resulting from COVID-19 is expected to last well beyond the end of the COVID-19 pandemic, the end of which in itself is highly uncertain. This will have an adverse impact on ADP's earnings for an indefinite period. The main issue with ADP's share price is the company has been attracting a very high P/E multiple due to a record of high EPS growth. A combination of a reduction in EPS due COVID-19 and a reduction in P/E multiple due to curtailed growth represents a double whammy for the share price. That impact has likely not yet been fully felt. It might not be fully reflected in the share price until full-year results through end of June are announced in July or thereabouts. The company has a solid balance sheet, with negligible net debt, and will likely continue to show positive, although reduced, earnings, and will certainly survive through this pandemic. The issue is purely with the share price which has not adjusted sufficiently to reflect the environment the company now operates in.
The full year results are now in, and ADP non-GAAP EPS beat 4th quarter estimates. That does not change my view. ADP issued 2021 guidance at the same time as release of its 4th quarter and full year results. That guidance included, "Adjusted diluted EPS decline of 13% to 18%". This was the first time analysts had the benefit of ADP guidance for 2021. Subsequent to this advice, analysts' forward EPS estimates were reduced below the levels at the time of my previous article. The share price is now a few dollars higher and the EPS outlook has worsened. I maintain a 'sell' on ADP, mainly because ongoing declines in ADP TTM EPS will likely see periods of much lower share price over the next year or two. At the same time, for long term holders, there is light at the end of the tunnel, as shown in my projections below. For those investors, continuing to hold would be a reasonable option.
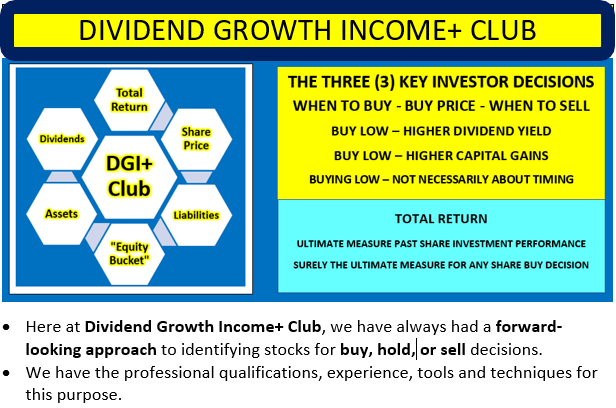
The Dividend Growth Income+ Club Approach
The logo of the DGI+ Club explained:
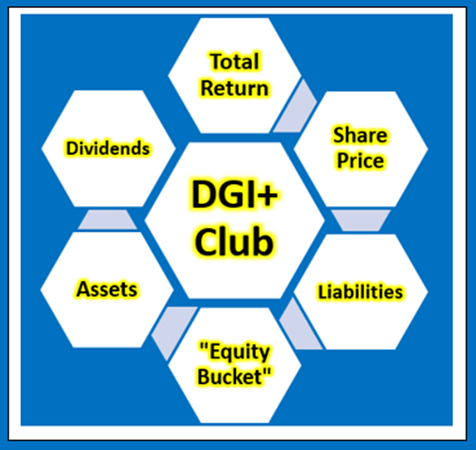
Total Return, Dividends, Share Price
The only way an investor can achieve a positive return on an investment in shares is through receipt of dividends and/or an increase in the share price above the buy price - the only way. For more information and background on share value assessment please visit, "Forget Irrelevant Valuations, Returns Based Investing Is A Better Approach" and "Free Cash Flows: Let's Have A Discussion Towards A Better Understanding."
Assets, Liabilities
The engines and the lubrication, along with human talent, drive the business. Shareholders have no legal rights to or ownership of the assets. Shareholders in a limited liability company have no legal obligations in respect of the liabilities.
"Equity Bucket"
Shareholders have an equitable entitlement to their equity in the company. Equity is increased by capital raised from shareholders, and by earnings of the company. While shareholders have an equitable entitlement to their equity in the company, they have little to no say in how the equity is distributed. In some companies, management actions in respect of the shareholders' equity do not always benefit shareholders and can be highly detrimental to shareholders. At the DGI+ Club, in addition to reviewing profitability, balance sheet strength, liquidity, and other metrics, we take the extra step of checking the "Equity Bucket" for "leaks", i.e., effective distributions out of or other reductions in equity that do not benefit shareholders.
Below, I address:
- Historical And Potential Future Shareholder Returns
- Checking the ADP "Equity Bucket"
Automatic Data Processing: Assessing Historical And Potential Future Shareholder Returns
In this article and in most of my articles, I seek to show how targeting a desired return on an investment in shares can be facilitated by actually estimating what future returns will be based primarily on analysts' EPS estimates and other publicly-available data. After all, gaining a return is the primary aim of most investing.
First, I provide details of actual rates of return for ADP shareholders investing in the company over the last four to five years.
Table 1 - Automatic Data Processing: Historical Shareholder Returns

For many stocks where I create a table similar to Table 1 above, I find a wide range of returns indicating a degree of volatility and risk. Table 1 above shows the results for ADP were positive for six of eight different investors, each investing $3,000 over the last five years and holding to the present. The pattern of rates of return is interesting. For shares purchased in 2017 or prior, the rates of return are in the high single or double digits. Subsequent to 2017, as the share buy price took a sudden jump upward, rates of return have fallen to single digit and negative. These rates of return, ranging from negative (22.7)% to positive 13.7% are not just hypothetical results. They are very real results for anyone who purchased shares on the various dates and held through to August 7, 2020. Of course, before the fall in share price due to the COVID-19 effect, rates of return would have been much higher for all eight investors. In the above examples, the assumed share sale price is the same for all investors, illustrating the impact on returns of the price at which an investor buys shares.
Projecting Future Shareholder Returns
If rate of return is the basis on which we judge the performance of our investments, then surely we should be seeking to estimate future likely rates of return when we are making investments. But how do we do that? I use proprietary models to generate net income, balance sheet/funds flows, and projected rates of return going out three to five years. Much of this is automated, but still involves a great deal of research and business and data analysis to back up the projections. Let us first look at the traditional approach to assessing value of a stock for investment purposes.
Assessment Based On Quant Ratings For Share Investment Decisions
Share buy price, dividends, share sale price, and duration the shares are held are the only factors affecting the return on an investment in shares. That makes potential share sale price the single most important and uncontrollable unknown when making a share buy decision. My expertise is in fundamental analysis, but I do recognize, any methodology, Quant or Elliott Waves or other techniques providing assistance in assessing possible future share price direction, can be of benefit to share investors. I find SA Quant ratings useful for both screening for stocks of interest and as a form of due diligence.
Figure 1

Quant ratings for ADP show the company strong on 'profitability' and weak to very weak on all other ratings. Since I last wrote on ADP the Quant rating has shifted from Neutral to Bearish.
Assessment Based On Analysts' EPS Estimates
Figure 2 - Summary Of Analysts' Adjusted Non-GAAP EPS Estimates

Some observations on contents of Fig. 2 -
- I convert all quarters to calendar quarters for comparability of periods to other tickers. ADP fiscal year end is June 30, so Q2 in Fig. 1 above is ADP fiscal Q4. For this reason I have included only analysts' quarterly estimates in Fig. 2.
- Analysts' estimates for ADP are only available out to first half of calendar 2023, so I have only included estimates to end of calendar 2022.
I incorporate the above analysts' EPS estimates from SA Premium into my rate of return projections utilizing my proprietary 1View∞Scenarios Dashboards further below. As for Quant ratings, EPS and EPS growth estimates do not quantify the rate of return that can be expected for the stock in question.
Figure 3 - Non-GAAP P/E Ratios, Historical And Future Estimates
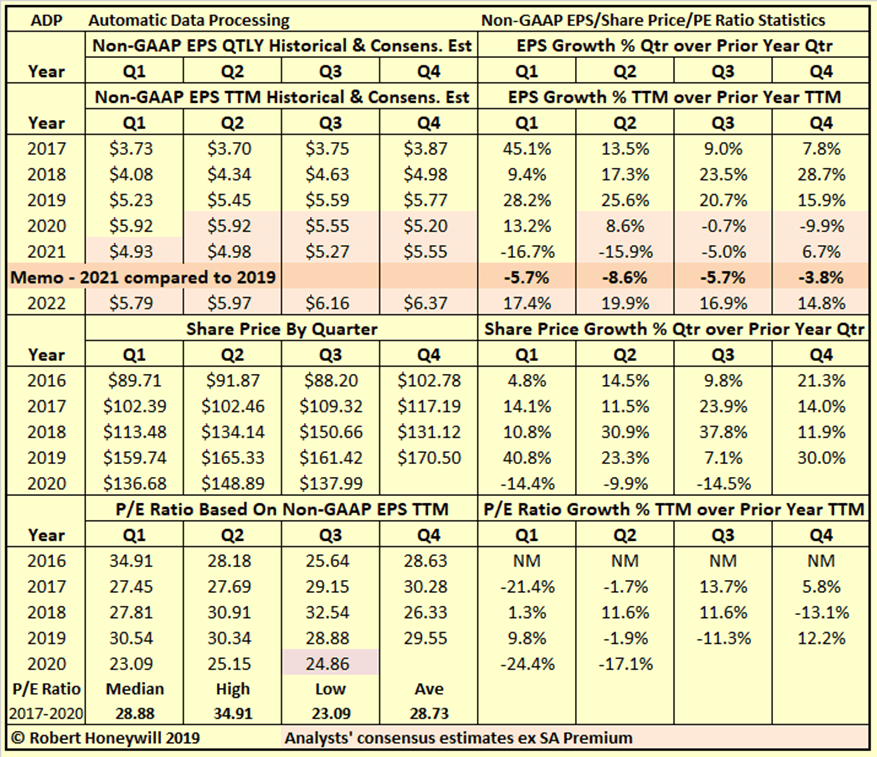
Figure 3 is primarily designed to determine an appropriate range of non-GAAP P/E ratios for determining estimated future share price levels for ADP. This is necessary for quantifying estimated future rates of return. Figure 3 also informs us of past non-GAAP EPS growth rates compared to forward estimates of EPS growth based on analysts' consensus estimates. The forward EPS consensus estimates indicate expectations of negative growth rate of (9.9)% for calendar 2020 over calendar 2019. Analysts' consensus estimate of EPS for calendar 2021 is estimated to be 6.7% up on a depressed calendar 2020 and still down 3.8% on calendar 2019. It should be understood, in quantifying the estimated rates of return below, I'm relying on the soundness of analysts' consensus estimates of EPS. The other important factor is determining appropriate future P/E ratios, which is fraught with difficulty. P/E ratios are impacted by issues both at the macro and micro level. I don't believe I will have any arguments against the notion P/E ratios are influenced by actual and expected EPS growth rates. I'm able to quantify potential rates of return under various scenarios utilizing my proprietary 1View∞Scenarios Dashboards.
Assessment Based On Quantification Of Potential Rates Of Return
My forward-looking analyses bring another dimension - the quantification of potential returns utilizing various pieces of financial information already available.
Table 2.1 - 1View∞Scenarios Dashboard Projected Rates Of Return

Table 2.1 shows buying at the current share price would provide indicative rates of return of negative (9.5)% to positive 7.0% for 2020 to 2021. These rates of return assume EPS results in accordance with analysts' consensus, high and low estimates (adjusted as indicated) and a constant adjusted non-GAAP P/E ratio of 23.31 (current P/E ratio). The P/E ratio of 23.31 is well below the historical median of 28.88 (per Fig. 3 above). But this historical median ratio is from a period of much higher EPS growth than is currently estimated for the period ahead. The average yearly EPS growth rate for 2016 to 2019 was 17.1%. Based on analysts' consensus estimates average yearly EPS growth rate for 2019 to 2022 is expected to be 3.4%. This could result in the P/E ratio declining further from current level.
Table 2.2 - 1View∞Scenarios Dashboard Projected Rates Of Return - Stress testing

Table 2.2 uses the same assumptions as in Table 2.1 above, except for a ~8% reduction in the P/E ratio from the present 23.11 to 21.54. Ending share price for 2020 is assumed to be 15% below the current share price (at $117.29, still well above the low of $104.89 on March 23, 2020). At the assumed lower P/E ratio, potential returns for 2020 and 2021 are negative for all cases, except the high case in 2021. Holding through end of 2022 results in low to mid single-digit positive returns indicated for the consensus and high cases, with negative return indicated for the low case. This is not encouraging as 21.54 is still a relatively high multiple to maintain.
Table 2.3 - 1View∞Scenarios Dashboard Projected Rates Of Return - Aiming For A Lower Buy Price

Table 2.3 projections have similar assumptions as for Table 2.2, except for an assumed buy price 15% lower than the current share price. Waiting for a lower share price around the $117 mark, even if it should eventuate, might require a deal of time and patience. The share price quickly rebounded off its low of $104.89 on March 23 and has traded in the $130 to $145 range more recently. Buying at the lower price still only results in positive return estimate of 4.5% for the consensus case for 2021, hardly enough for the associated risk. Rate of return for the high case for 2021 is higher at ~13% but low case estimate is negative (4)%.
Checking the ADP "Equity Bucket"
Table 3.1 ADP Balance Sheet - Summary Format

Period June 30, 2016 to June 30, 2020 (4 years)
Table 3.1 shows ADP has increased net assets used in operations by $2,587 million over the last 4 years. This increase was funded by a $1,271 million increase in equity and $1,317 million comprised of a mixture of cash, $1,207 million, and increase in debt of $110 million. The $1,271 million increase in shareholders' equity over the last 4 years is analyzed in Table 3.2 below.
Table 3.2 ADP Balance Sheet - Equity Section

I often find with companies, while they produce earnings that add to shareholders' equity, significant amounts of distributions out of equity do not benefit shareholders. Hence the term "leaky equity bucket." I do not see that with ADP - the company's profits are being managed very much for the benefit of its shareholders. A significant percentage of profits is distributed to shareholders by way of dividend. Share repurchases are effectively reducing outstanding share count. Detailed comments on the management of shareholders' equity appear below.
Explanatory comments on Table 3.2 for the period June 30, 2016, to June 30, 2020:
- Reported net income (non-GAAP) over the 4-year period totals to $9,037 million, equivalent to diluted net income per share of $20.54.
- The non-GAAP net income excludes $605 million of expense items, regarded as unusual or of a non-recurring nature, in order to better show the underlying profitability of ADP. In the case of ADP the net total adjustment is primarily due to 'transformation initiatives'. These items decreased GAAP EPS over the 4-year period by $1.38 per share compared to the reported non-GAAP result.
- Other comprehensive income includes such things as foreign exchange translation adjustments in respect to buildings, plant, and other facilities located overseas and changes in valuation of assets in the pension fund - these are not passed through net income as they fluctuate without affecting operations and can easily reverse in a following period. Nevertheless, they do impact on the value of shareholders' equity at any point in time. For ADP, these items were positive $1,192 million and increased EPS by $2.72 over the 4-year period.
- There were share issues to employees, and these were a significant expense item. The amounts recorded in the income statement and in shareholders' equity, for equity awards to staff, totaled ~$1,116 million ($2.53 EPS effect) over the 4-year period. The market value of these shares is estimated to be roughly $1,172 million, $56 million greater than the amount recorded for stock compensation expense purposes recognized in net income and in equity over the 4-year period. The estimated EPS effect for ADP of the $56 million is $0.13 over the 4 years and from an accounting standpoint this would not be regarded as material.
- By the time we take the above-mentioned items into account, we find, over the 4-year period, the reported non-GAAP EPS of $20.54 ($9,037 million) has increased to $21.76 ($9,568 million) net income from operations, added to funds available for distribution to shareholders.
- Issues of staff shares, assessed at estimated market value, increased equity by an estimated $1,172 million over the 4 year period. Share repurchases totaled $4,479 million. After taking account of shares issued to staff, net repurchases were $3,307 million.
- To sum up, over the 4 years, out of the $9,568 million net income from operations, $3,307 million was used for net share repurchases and $4,991 million for dividend payments, leaving a balance $1,270 million increase in equity.
- At June 30, 2020 the company had debt of $2,018 million and cash of $1,909 million resulting in minimal debt net of cash of $110 million.
Automatic Data Processing: Summary and Conclusions
The full year 2020 earnings result is now out and ADP's June 4th quarter results beat estimates. But ADP also provided 2021 guidance with the 2020 result, and forward EPS estimates are now below those current at the time of my previous article. Accordingly, I see a worsening of the outlook for ADP share price in the near to medium term.
Dividend Growth Income+ Club - Register today for your Free Trial.

Click Triple Treat Offer (1) Your Free 2 Week Trial; (2) 20% Discount New Members; (3) Bespoke reviews for tickers of interest to subscribers.