
Investment Thesis
Houston-based Schlumberger Limited (NYSE:SLB) released its second-quarter 2021 results on July 23, 2021.
The World's top oilfield services provider came out with second-quarter of 2021 earnings of $0.30 per share, beating analysts' expectations. Revenue was up 5.2%, from $5.356 billion last year to $5.634 billion.
CEO Olivier Le Peuch said in the conference call:
Our second-quarter results demonstrated very broad strength in our core portfolio as we continued to fully capitalize on the short- and long-cycle activity recovery - across Divisions, operating environments, and geographies both in North America and internationally. The combination of revenue quality, solid execution and vastly improved operating leverage delivered our fourth consecutive quarter of margin expansion.
The investment thesis remains constant quarter after quarter. Schlumberger is a solid oilfield services company that fits a long-term investment profile. However, the "service" segment is not my first choice in the oil industry. The extra volatility attached to this sector is highly correlated to oil prices but only indirectly. Furthermore, I find the dividend isn't attractive enough for a pure long-term bet.
However, an investor could easily use SLB secondary to an investment in an oil supermajor like Chevron Corp. (CVX) or Royal Dutch Shell (RDS.A) (RDS.B).
Thus, trading your long-term position is a wise idea. It is reasonable to allocate about 50% or more of your long-term position to trade short-term. You can see it as insurance against the inevitable booms and busts like we've experienced already and that we are likely to experience the remaining of 2021 and 2022.
Schlumberger has significantly outperformed the VanEck Vectors Oil Services ETF (OIH) and even its main rival Halliburton (HAL), as we see below. SLB is up 53% on a one-year basis.
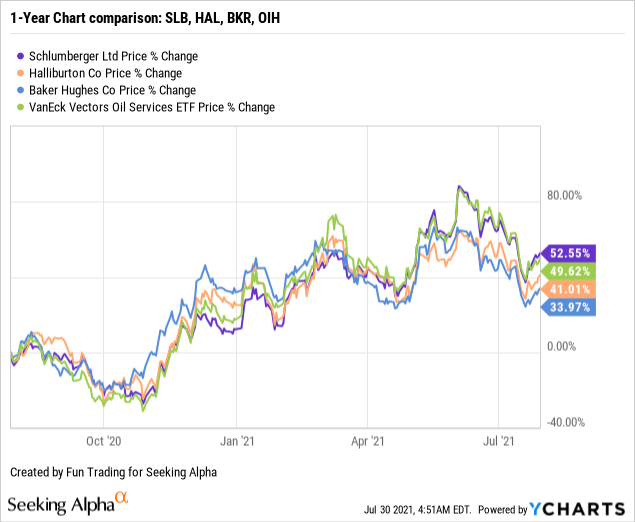
Note: I recommend reading my recent article on Halliburton on July 21, 2021, by clicking here, and Baker Hughes on July 27, 2021, by clicking here.
Revenue details: Schlumberger versus Halliburton in
2Q
21
Schlumberger and Halliburton have very similar business models and are considered the most powerful oilfield services companies. Let's compare the two.
As I said above, both companies have beaten expectations and are increasingly optimistic about 2021 prospects. CEOs Olivier Le Peuch and Jeff Miller were clearly optimistic about 2021, especially the second half.
CEO Jeff Miller said in the Halliburton conference call:
Halliburton has the broadest market exposure because we remain the only integrated service provider active in both North America and international markets. I believe this unique position allows us to capitalize on the double-digit growth, equipment tightness, and resulting in better service pricing in both markets.
Halliburton's revenues are relying more on the US segment, making it more vulnerable than Schlumberger's.
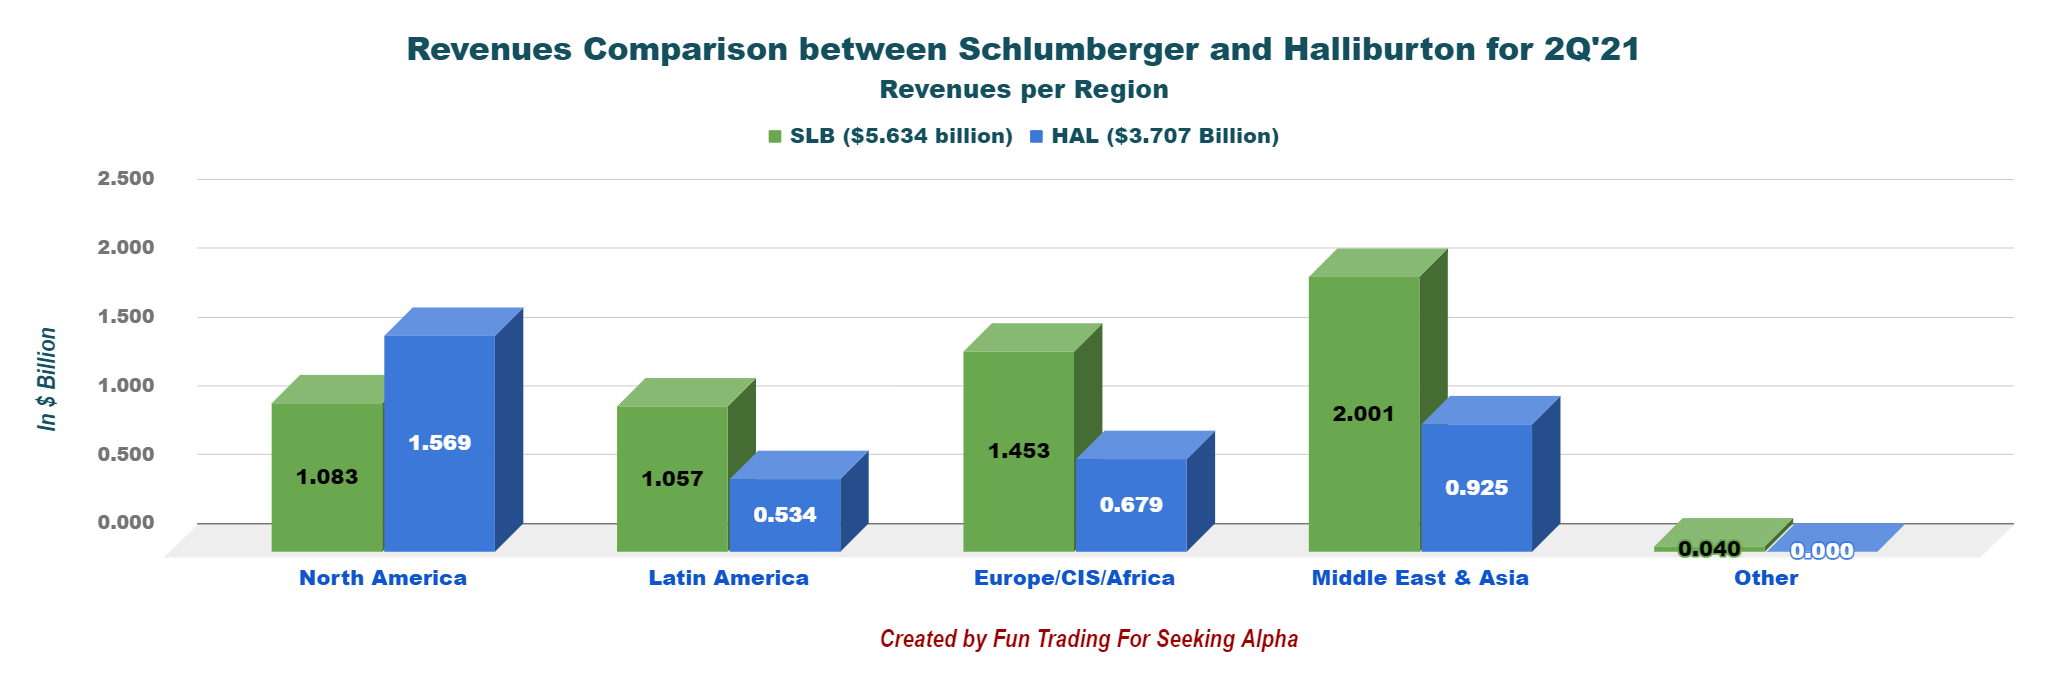
1 - Comparison per region
Schlumberger's total revenues were $5.634 billion in 2Q21. The North American region represented 19.2% of the total revenues. 
On the other hand, Halliburton has a much more significant presence in North America, representing 42.3% of its total revenues of $3.707 billion in 2Q21.

Thus, Halliburton's business model is more sensitive to any change in business activities in the North American region. Conversely, Schlumberger has more presence in the Middle East and European segments.
2 - Comparison per segment
Schlumberger's revenue repartition includes four categories or units (including Cameron Group), while Halliburton indicates only two. Basically, it is the same but classified differently.
However, it is easy to compare both companies with the graphs below:

If we compare activities per segment with Halliburton, we see a similar pattern between Drilling and Production.

3 - Detailed revenues per region: Comparing 1Q21 to 2Q21
This chart reaffirms what has been said above, Halliburton revenues are higher in North America.
Schlumberger: Financials: 2Q21, Trend And Raw numbers
| Schlumberger | 2Q20 | 3Q20 | 4Q20 | 1Q21 | 2Q21 |
| Total Revenues in $ Billion | 5.36 | 5.26 | 5.53 | 5.22 | 5.63 |
| Net Income in $ Million | -3,434 | -82 | 374 | 299 | 431 |
| EBITDA $ Million | -2,879 | 84 | 1,198 | 1,054 | 678 |
| EPS diluted in $/share | -2.47 | -0.06 | 0.27 | 0.21 | 0.30 |
| Cash flow from operating activities in $ Million | 803 | 479 | 878 | 429 | 1,220 |
| CapEx in $ Million | 251 | 200 | 258 | 178 | 243 |
| Free Cash Flow in $ Million | 552 | 279 | 620 | 251 | 977 |
| Total Cash $ Billion | 3.59 | 3.84 | 3.01 | 2.91 | 2.68 |
| Total LT Debt in $ Billion | 17.37 | 17.76 | 16.89 | 16.89 | 15.72 |
| Dividend per share in $ | 0.125 | 0.125 | 0.125 | 0.125 | 0.125 |
| Shares Outstanding (Diluted) in Million | 1,388 | 1,391 | 1,411 | 1,419 | 1,421 |
Source: Company release
Revenues, Free Cash Flow, And Debt Analysis
1 - Revenues of $5.634 billion at the end of June 2021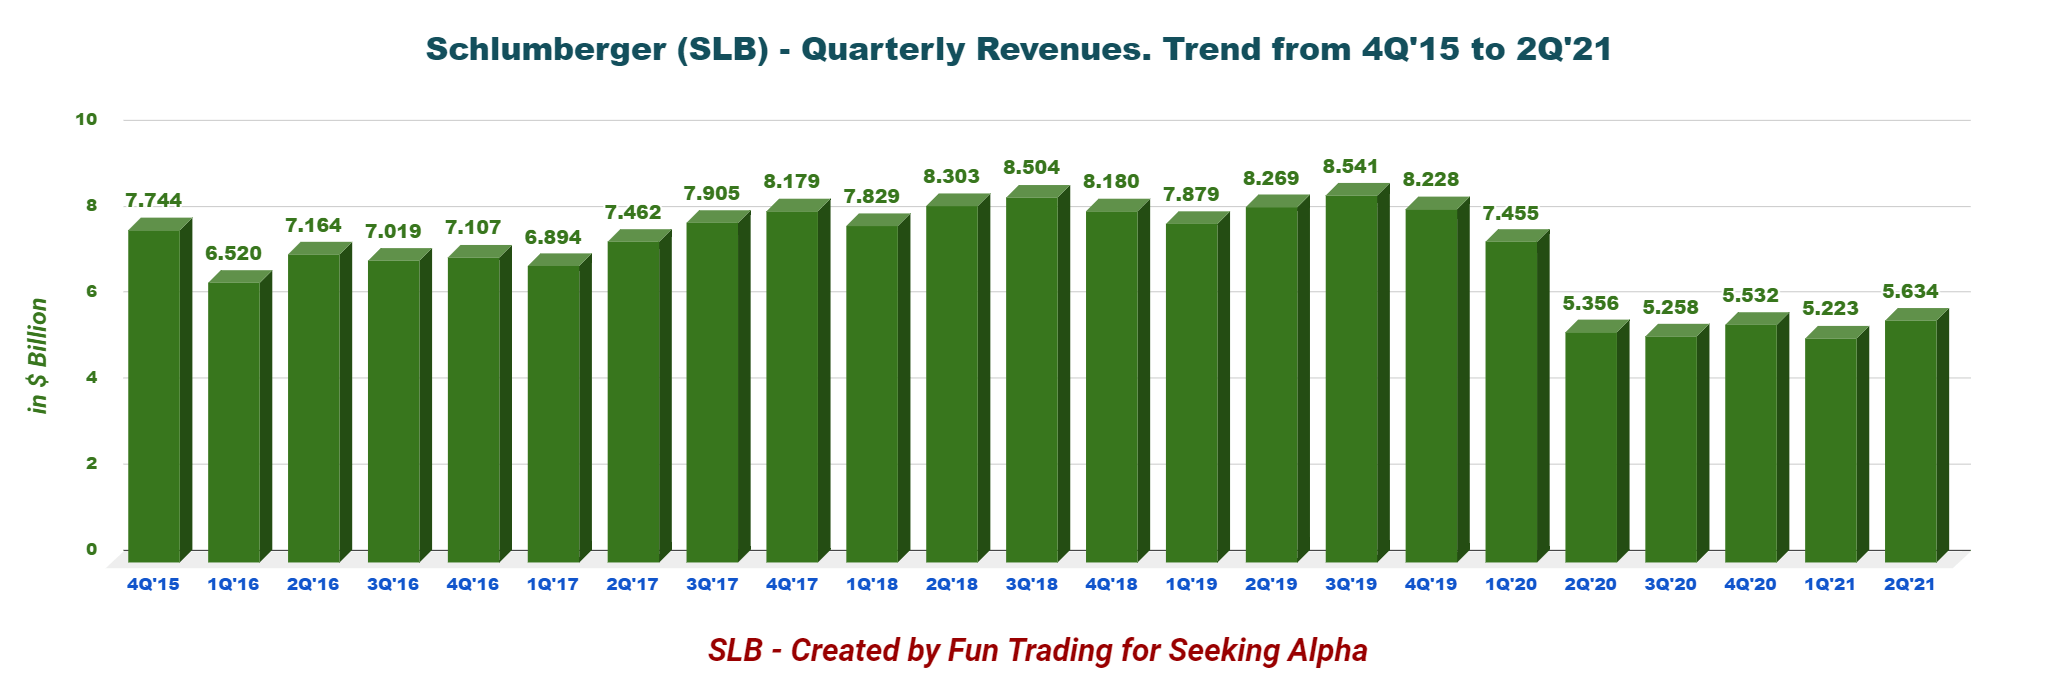 Oilfield service giant Schlumberger recorded total revenues of $5,634 million for the second quarter of 2021, beating analysts' expectations. Net income came in at $0.30 per share.
Revenues were significantly higher.

CFO Stephane Biguet said in the conference call:
There were no charges or credits recorded during the first or second quarters of 2021. Overall, our second quarter revenue of $5.6 billion, increased 8% sequentially. North America revenue increased 11% sequentially, while international revenue increased 7%, both outpacing respective rig count growth.
2 - No change in 2021 outlook
Schlumberger reaffirmed the 2021 capital investment view within $1.5-$1.7 billion. 2020 CapEx was $1.5 billion.
Schlumberger anticipates a boost in oilfield services and activities in international markets through 2021-end and beyond with double-digit growth in second-half 2021 for the International segment.
Conversely, the North American market is expected to experience a more subdued growth.
3 - Free Cash Flow was $977 million in 2Q21 (estimated by Fun Trading).  Note: The generic free cash flow is the cash from operating activities minus CapEx. The difference is how the CapEx is calculated. Schlumberger used a CapEx, including investments in APS projects and multi-client. I used a CapEx of $243 million.
Trailing free cash flow was $2,080 million ttm, and 2Q21 free cash flow was estimated at $977 million.
The Free cash flow is covering the dividend payment. The quarterly dividend is $0.125 per share or 1.7%.
4 - Net Debt is $13.04 billion at the end of June 2021. Still too high.  On June 30, 2021, the company had approximately $2,682 million in cash and short-term investments, down from $2,910 million in 1Q21. The company indicated a net debt of $13.041 billion.
Long-term debt (including current) of $15,723 million at second quarter-end, down from $16,583 million at the end of March 2021, with a debt to capitalization of 55%.
On June 28, 2021, the company repurchased $665 million of its outstanding 3.3% senior notes due September 2021.
Conclusion and Technical Analysis
Schlumberger's second-quarter results were solid and beat analysts' expectations.
The company's results were impressive, with profits exceeding forecasts by a larger rate than Halliburton or Baker Hughes, reported earlier in the week.
Schlumberger is clearly enjoying the benefits of a recent attempt to restructure and slim down its business by focusing more on its international growth than on its North American operations. Even so, the company experienced 11% growth in this segment in 2Q21.
The result is that margins are back to a healthy level with a near-double from the same quarter a year ago, with surprisingly strong growth from its North American segment.
Technical Analysis
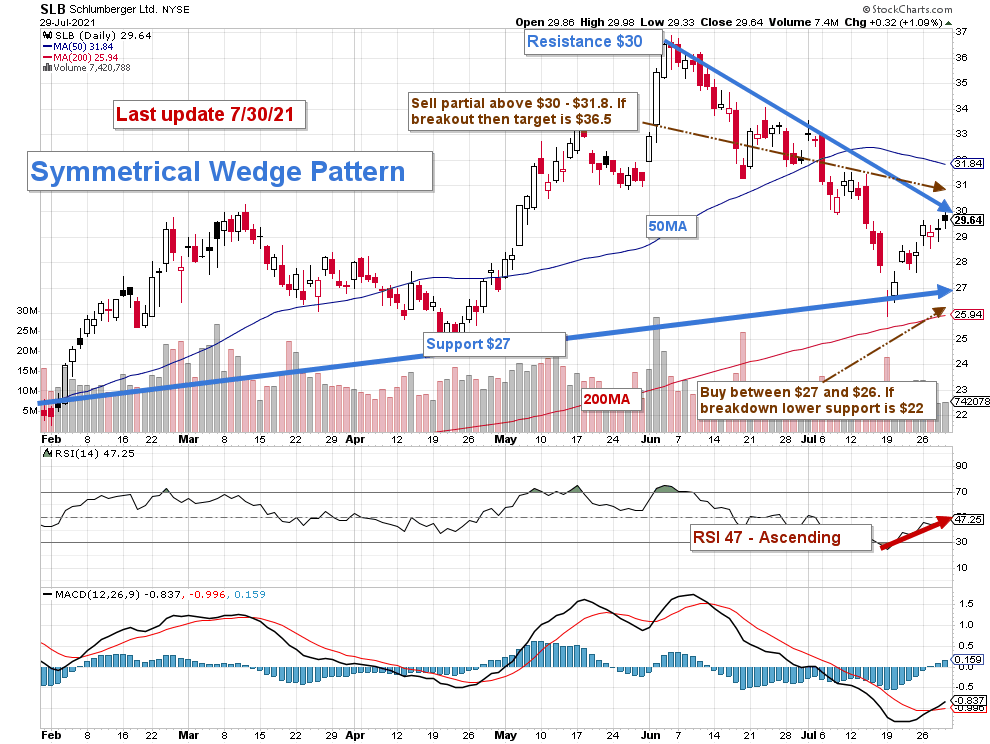
Note: the chart has been adjusted for dividends.
SLB forms a symmetrical wedge pattern with resistance at $30 and support at $27. The trading strategy now is to take profits between $30 and $31.8 and wait for a retracement between $27.25 and $22.
SLB is highly correlated to oil prices and will be subject to frequent mood swings. I suggest taking advantage of this situation by taking profits often and repeat.
Warning: The chart analysis above is valid only if it is updated frequently. It is what I am doing for my subscribers only.
Author's note: If you find value in this article and would like to encourage such continued efforts, please click the "Like" button below as a vote of support.

Join my "Gold and Oil Corner" today, and discuss ideas and strategies freely in my private chat room. Click here to subscribe now.
You will have access to 57+ stocks at your fingertips with my exclusive Fun Trading's stock tracker. Do not be alone and enjoy an honest exchange with a veteran trader with more than thirty years of experience.
"It's not only moving that creates new starting points. Sometimes all it takes is a subtle shift in perspective," Kristin Armstrong.
Fun Trading has been writing since 2014, and you will have total access to his 1,988 articles and counting.