"I will go to my grave... believing that really loose monetary policy greatly contributed to the Financial Crisis. There were obviously problems with regulation, but when we had a 1% Fed Funds rate in 2003 after, to me, it was pretty obvious that the economy had turned ((UP)) and I think the economy was growing at 7% to 9% nominal in the fourth quarter of 2003 and that wasn't enough for the Fed. They had this little thing called 'considerable period' on top of the 1% rate just so we would make sure that their meaning was clear. And it was all wrapped around this concept of an insurance cut… I've made some money predicting boom-bust cycles. It's what I do. Sometimes I am right. Sometimes I am wrong, but every bust I had ever seen was proceeded by an asset bubble generally set up by too loose policy..."
- Stanley Druckenmiller
Introduction
My father was stationed at Vandenberg Air Force Base in California during the 1970's, prior to when I was born, and visiting my grandmother's house, I often saw, and distinctly remember, a missile launch picture hanging over his bed in his childhood bedroom, which was later turned into a guest room. A majority of the missiles launched from Vandenberg had a future date with some parcel of land on earth, and these would have to be tracked down and cleaned up, a far less glamorous task than the eye grabbing launch phase.
Similar to the gravitational pull of earth, the gravitational pull of the financial markets often drags supernova success stories back down to a less glamorous reality. We are seeing that with the ARK Innovation ETF (NYSEARCA:ARKK), which has had a sterling five-year plus run, however the gravitational pull of the markets is working their magic on the underlying hyper-valued companies held by ARKK, and the ARK Innovation ETF itself is losing its momentum.
The end result is that ARKK shares are still down over 20% from their 2021 year-to-date and all-time highs, even with the broader market, as measured by the SPDR S&P 500 ETF (SPY), and the Invesco QQQ Trust (QQQ) both recently notching new all-time highs.
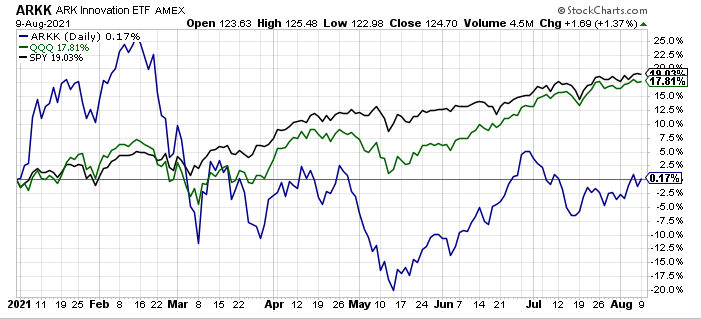 (Source: Author, StockCharts.com)
Thus, while ARKK shares are still up 0.2% in 2021 in absolute terms through Monday's close, the fading relative performance is adding up to fund outflows. Ultimately, this will create an unvirtuous cycle, where ARKK fund outflows lead to more weakness in the top ARKK holdings, which will lead to more fund outflows. This same pattern played out with many of the ultraconcentrated technology laden funds of the late 1990's, and early 2000's. On this note, remember the Jacob Internet Fund (JAMFX)?
The lesson learned from that era, one I lived through vividly, and personally, as a stock broker at Charles Schwab Corp. (SCHW) was to pay attention to price action, fund flows, and most importantly, starting valuations. Unfortunately, many market participants today are going to learn the same lesson as the late 1990's and early 2000 investors, and that learning experience is set to be a painful one.
ARKK Is A Supernova
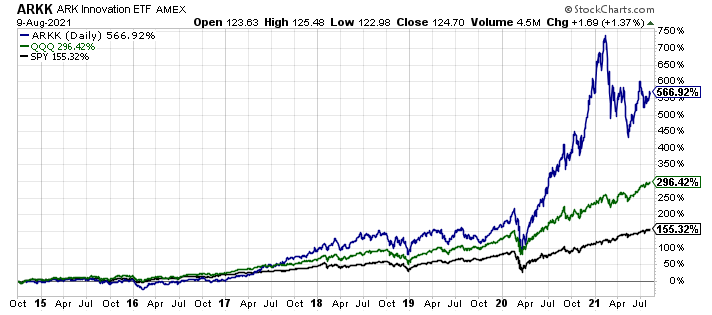
It is hard to believe, however, the ARK Innovation ETF has not been around that long. In fact, here is a long-term chart that shows that reality, with the ETF launched in the latter part of 2014, specifically in October of 2014.
 (Source: Author, StockCharts)
Obviously, as the chart shows above, ARKK really gained traction following the market's bottom in 2016, and since then, it has been off to the races, both in terms of performance and fund flows. Cumulatively, over this time frame, since its inception in October of 2014, ARKK has crushed the performance of the Invesco QQQ Trust and the SPDR S&P 500 ETF.
 (Source: Author, StockCharts)
However, as highlighted in the introductory section, as performance has waned in 2021, fund flows have suffered too.
Fund Flows Falter
Naturally, as ARKK's relative performance has faltered, fund flows into ARKK have faltered too, which is clearly shown in the graphic below from the August 6th, 2021, Financial Times article on ARKK below.
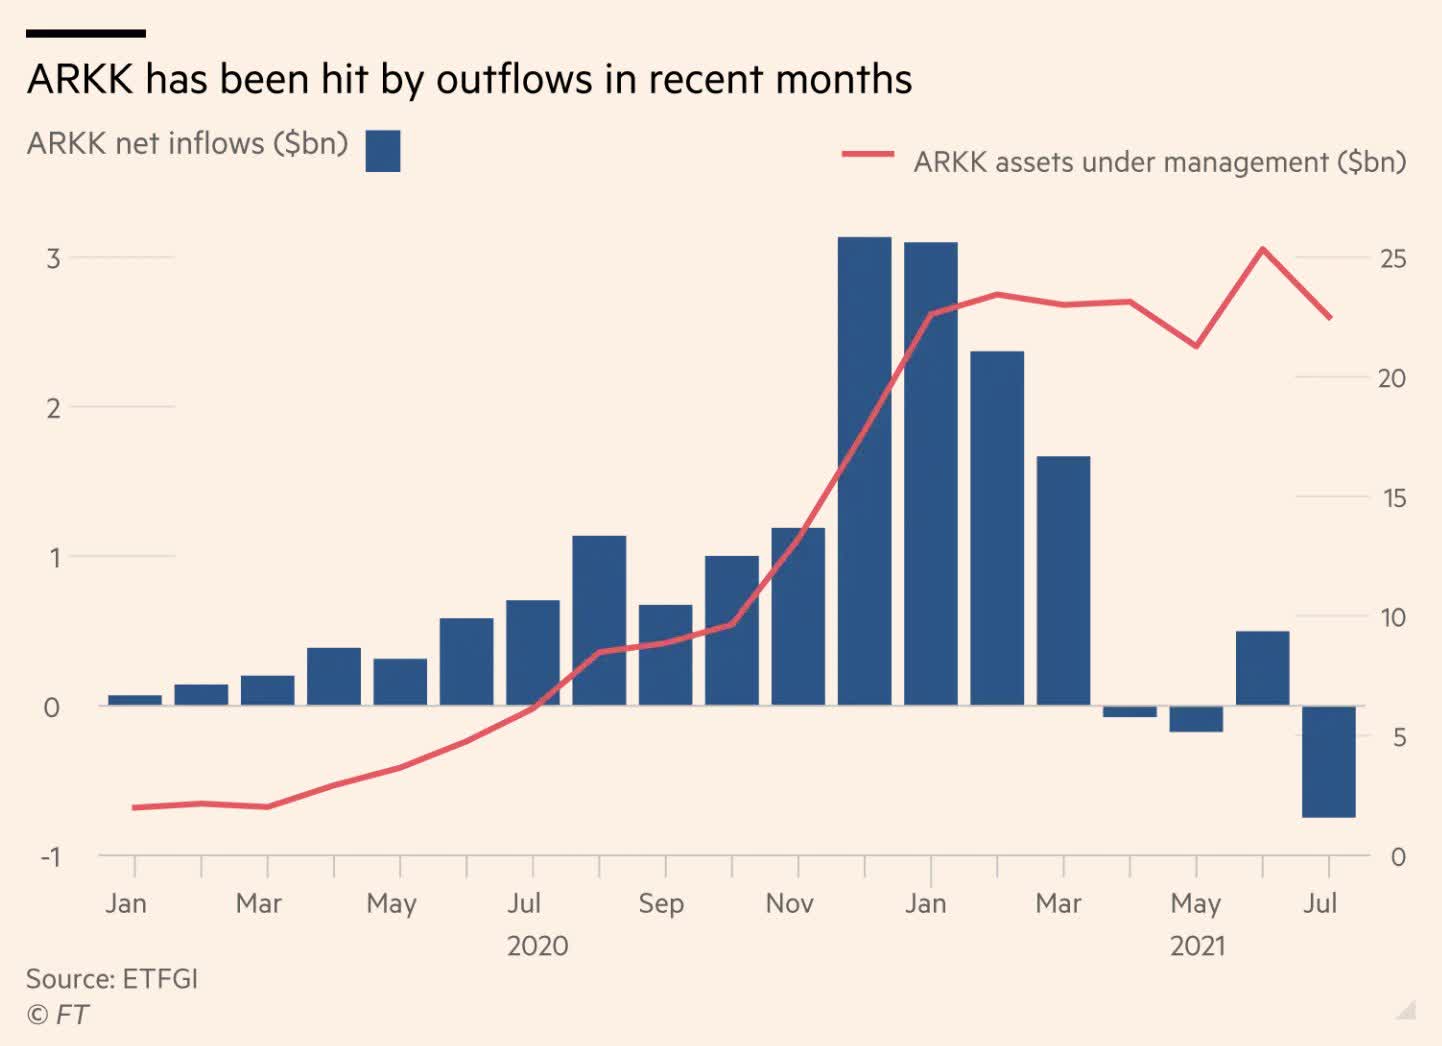 (Source: Financial Times)
Inflows that peaked at over $3 billion per month in December of 2020, and January of 2021 have turned negative.
Right now, this is only a relative performance problem, as ARKK is still up 0.2% year-to-date in 2021 through Monday, August 9th, 2021, and ARKK's assets under management are still near their all-time highs.
However, momentum has clearly waned, and if you look at the underlying holdings within the ARK Innovation ETF, there is a lot of room to fall, as starting valuations continue to be extremely poor.
Top-Ten Holdings At ARKK And Their Year-To-Date Performance
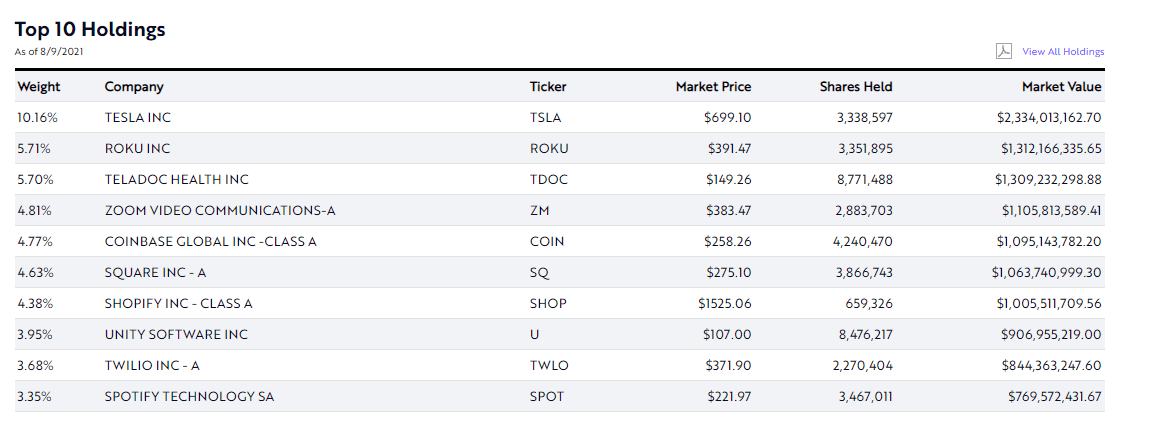
From the ARK Invest website, here is the top-ten holdings of the ARK Innovation ETF.
 (Source: ARK Invest)
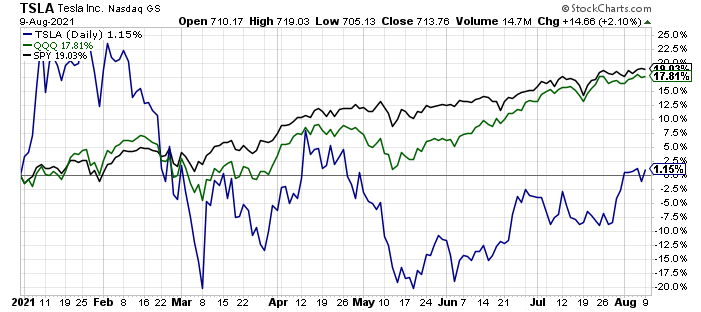
Now, here is the performance of each of the top holdings in the ARK Innovation ETF year-to-date, compared to the Invesco QQQ Trust and the SPDR S&P 500 ETF, starting with Tesla (TSLA). Tesla is by far the largest holding in the ARK Innovation ETF at 10.2% of assets, and shares of TSLA are only up 1.2% YTD, materially trailing the performance of both SPY, which is up 19.0% YTD, and QQQ, which is up 17.8% YTD.
 (Source: Author, StockCharts)
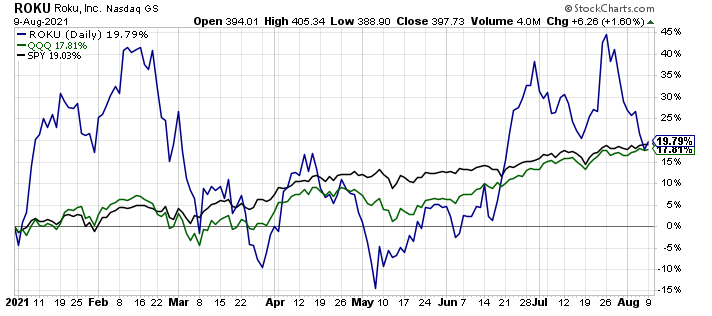
The second-largest holding in the ARK Innovation ETF is Roku Inc. (ROKU) at 5.7% of assets, and ROKU shares have performed much better than Tesla in 2021, gaining 19.8% YTD, however, ROKU shares are also sharply off their February and July highs.
 (Source: Author, StockCharts)
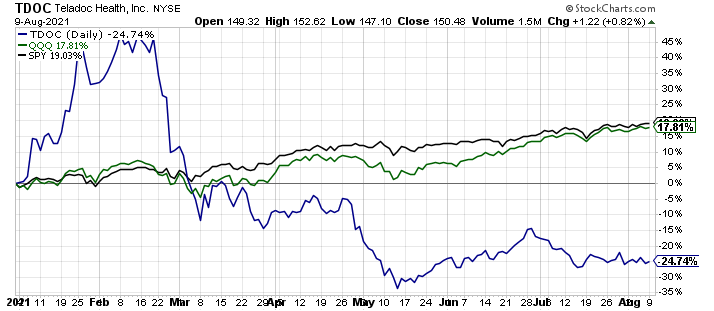
Teladoc Health Inc. (TDOC) is the third-largest holding in the ARK Innovation ETF at 5.7% of assets, and it has been a clear laggard in 2021, with shares down 24.7% YTD.
 (Source: Author, StockCharts)
The fourth-largest holding in the ARK Innovation ETF is Zoom Video Communications (ZM), which compromises a 4.8% weighting.
 (Source: Author, StockCharts)
Shares of ZM have rebounded from their May 2021 lows, however, even with spread of successive COVID variants, Zoom shares are underperforming year-to-date.
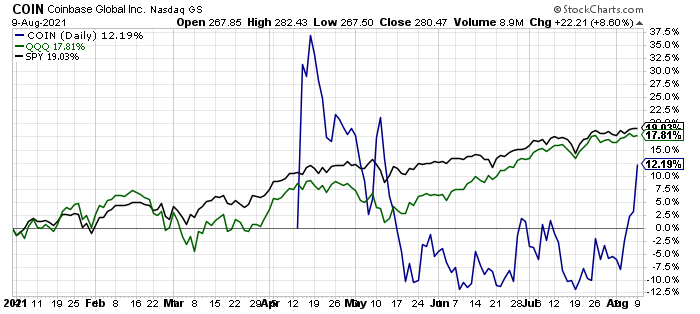
The fifth-largest holding in the ARK Innovation ETF is Coinbase Global (COIN) at 4.8% of assets rounding up.
 (Source: Author, StockCharts)
As the chart above shows, COIN shares have rallied strongly this past month, and they are up 12.2% YTD, however, they are underperforming the major broader market indices too.
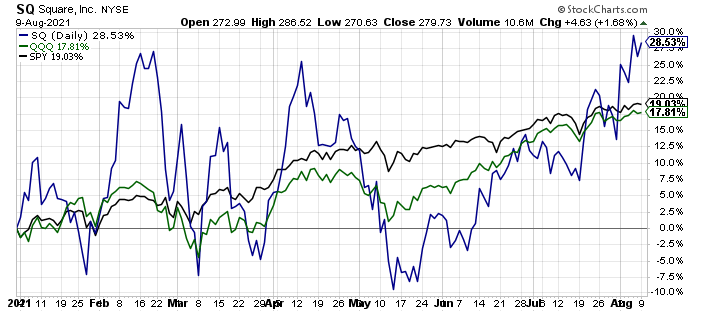
Next, with a 4.6% weighting in the ARK Innovation ETF, putting it as the sixth-largest position, Square Inc. (SQ) shares are higher by 28.5% YTD.
 (Source: Author, StockCharts)
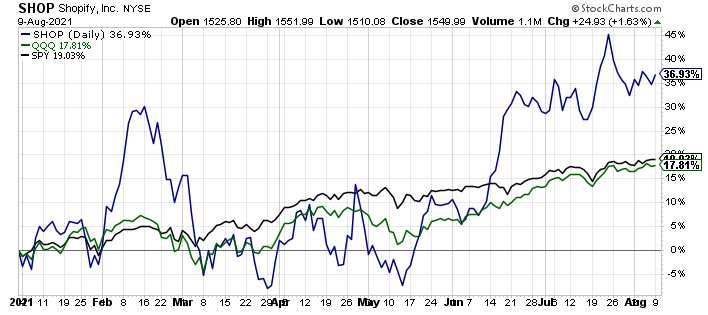
Seventh on the list of the largest positions in the ARK Innovation ETF is Shopify (SHOP), which accounts for a 4.4% weighting.
 (Source: Author, StockCharts)
Shopify shares have surged recently too, and they are up 36.9% YTD, the strongest performer so far in ARKK.
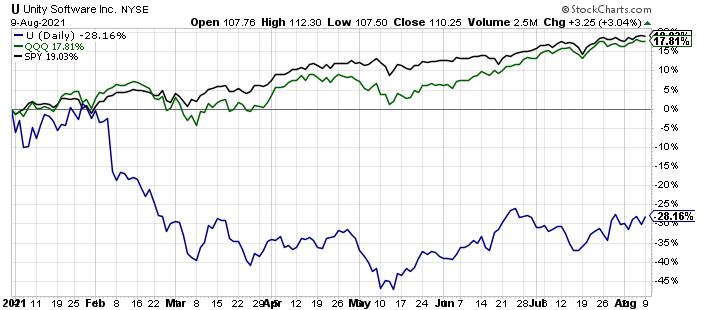
Unity Software (U) is the eighth-largest position in the ARK Innovation ETF at 4.0% of ETF assets.
 (Source: Author, StockCharts)
Shares of Unity Software have been a severe underperformer throughout 2021, and they currently have a 28.2% loss YTD.
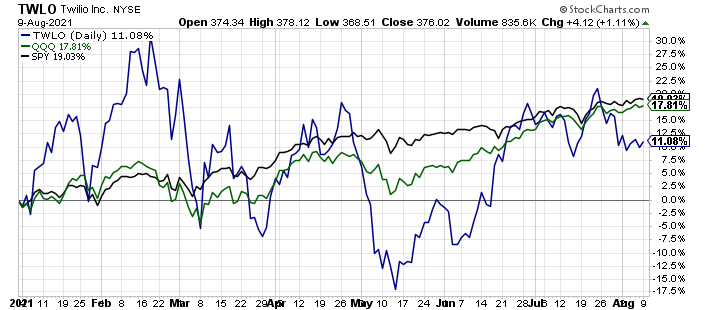
The ninth-largest position in the ARK Innovation ETF is Twilio Inc. (TWLO), which has a 3.7% weighting in the exchange traded fund.
 (Source: Author, StockCharts)
Shares of Twilio are up 11.1% year-to-date, underperforming SPY, and the QQQ's.
The tenth-largest position in the ARK Innovation ETF, at a 3.4% weighting, is Spotify Technology (SPOT), and this is actually the worst performer, by a hair over Unity Software year-to-date.
 (Source: Author, StockCharts)
Overall, here is the performance year-to-date of the top holdings, interspersed with the SPDR S&P 500 ETF, and the Invesco QQQ Trust.
- SHOP - Up 36.9%
- SQ - Up 28.5%
- ROKU - Up 19.8%
- SPY - Up 19.0%
- QQQ - Up 17.8%
- ZM - Up 13.6%
- COIN - Up 12.2%
- TWLO - Up 11.1%
- TSLA - Up 1.2%
- TDOC - Down 24.7%
- U - Down 28.2%
- SPOT - Down 28.6%
Only three holdings of the top-ten holdings in the ARK Innovation ETF, more specifically, Shopify, Square, and Roku, are outperforming the 19.0% gain in the S&P 500 Index, and the average performance of the top-ten holdings is a 4.2%. This is a better return than the ARK Innovation ETF itself, which remember is up only 0.2% YTD, however, that is because the bigger weighted positions, including TSLA and TDOC, have underperformed, and there are some significant laggards even among the underperforms, like Unity Software and Spotify.
This underperformance is only the tip of the iceberg, however, and here is why, starting valuations, as measured by the price-to-sales ratio, are still horrific.
Price-To-Sales Ratios Of The Top-Ten ARK Innovation ETF Holdings
Remember the importance of the price-to-sales ratio in forecasting future returns, something I have highlighted on numerous occasions with this quote from Scott McNealy, the former CEO of hyper valued Sun Microsystems in the 2000 tech mania.
At 10 times revenues, to give you a 10-year payback, I have to pay you 100% of revenues for 10 straight years in dividends. That assumes I can get that by my shareholders. That assumes I have zero cost of goods sold, which is very hard for a computer company. That assumes zero expenses, which is really hard with 39,000 employees. That assumes I pay no taxes, which is very hard. And that assumes you pay no taxes on your dividends, which is kind of illegal. And that assumes with zero R&D for the next 10 years, I can maintain the current revenue run rate. Now, having done that, would any of you like to buy my stock at $64? Do you realize how ridiculous those basic assumptions are? You don't need any transparency. You don't need any footnotes. What were you thinking?
Scott McNealy - Business Week 2002
When I referenced that quote in an Apple (AAPL) article I published on August 5th, 2020 titled, "Apple: Most Expensive Valuation In A Decade", which I then followed up with an article one-year later titled, "Apple: Still The Most Expensive Valuation In A Decade", I joked that Apple, which was trading at 7 times sales at the time, was not Tesla, which sported a price-to-sales ratio way over 10 at the time, though I did note that to be fair to Tesla, revenues could surge higher on higher vehicle volumes.
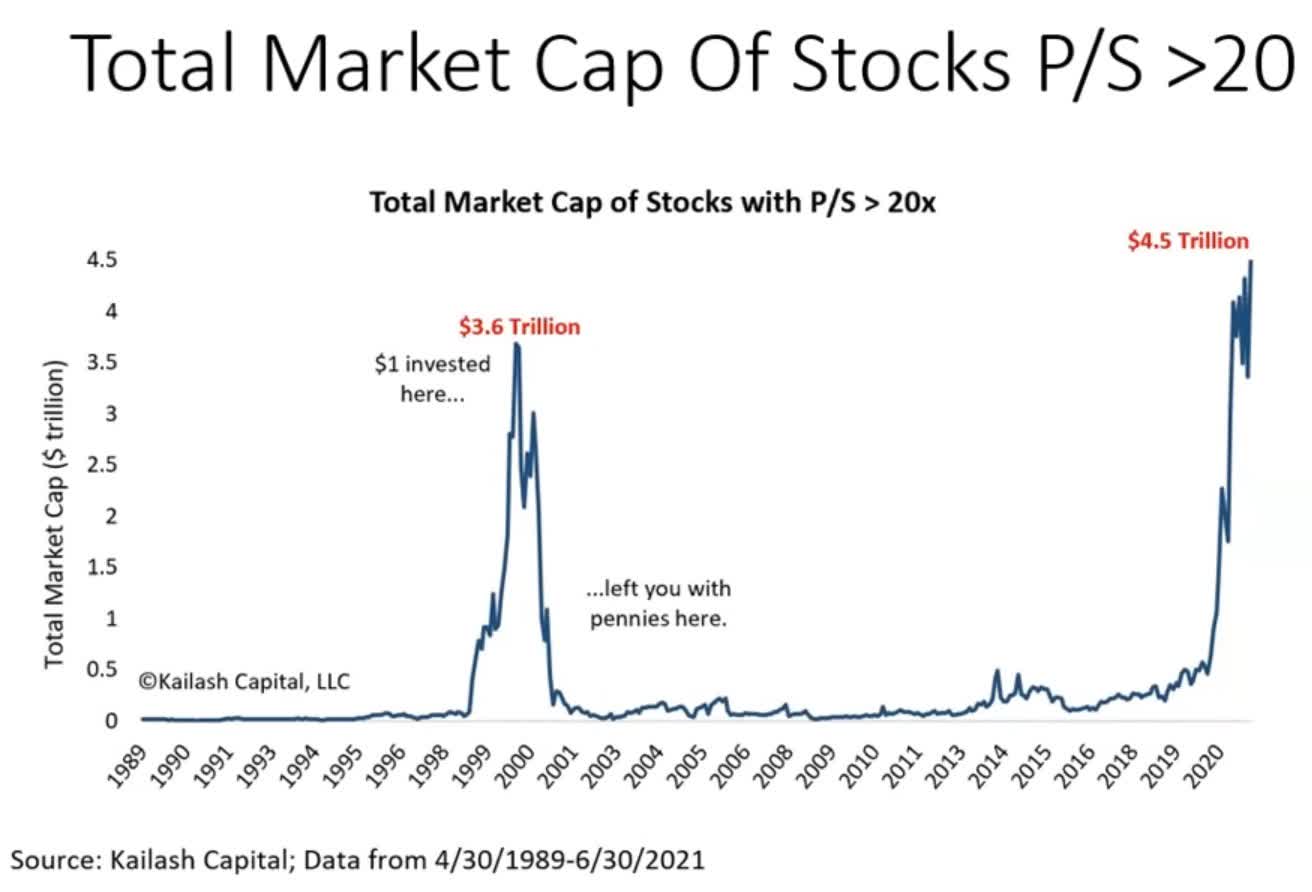
Ultimately, that dividing line of a 10 times price-to-sales ratio has proved to be a good barometer for historic overvaluation, and when you get to 20 times price-to-sales ratio, then the wheels really come off, which is perhaps best shown by this chart.
 (Source: Kailash Capital via John Polomny)
Given that background, what are the price-to-sales ratios of the top-ten ARK Innovation ETF components today. Here is a list I put together.
- Tesla - Price-to-sales ratio of 19.4
- Roku - Price-to-sales ratio of 23.3
- Teladoc Health - Price-to-sales ratio of 12.2
- Zoom Video - Price-to-sales ratio of 35.2
- Coinbase - Price-to-sales ratio of 17.8
- Square - Price-to-sales ratio of 9.2
- Shopify - Price-to-sales ratio of 50.7
- Unity Software - Price-to-sales ratio of 35.6
- Twilio - Price-to-sales ratio of 26.7
- Spotify Technology - Price-to-sales ratio of 4.1
Even with the relatively low price-to-sales ratios of Spotify, and Square, the average price-to-sales ratio for the top-ten components of the ARK Innovation ETF is 23.4.
Think about that for a minute, remember this graphic, and reread this whole section of this article again.
 (Source: Kailash Capital via John Polomny)
Investors need to remember the immortal conversation between Adrienne and Rocky in Rocky IV. Specifically, "You Can't Win"!
And, this time, Adrienne speaking to investors in the ARK Innovation ETF, or the aforementioned list of top-ten companies, would be right, meaning they can't win. We just cannot see it yet, not until this historic all-encompassing bubble bursts. This is something I wrote about in-depth last Friday with my article, "Run From Stocks, Hide From Bonds, And Embrace Commodities". Without a doubt the bubble will burst, it's coming, we just do not know when.
Let me say it again, investors in the ARK Innovation ETF cannot win today, not from the current starting valuation of its top-ten components, which has proven historically untenable.
Closing Thoughts: An Investor In The ARK Innovation ETF Can't Win From Today's Starting Valuations
Look forward, not backwards is a simple premise, yet it is hard to do in practice, as we are all adjusting our frame of reference to what has happened to us previously. This approach, of looking backward, not forward, is uniquely comforting in the investment markets, and as a market historian, and an avid practitioner for more than 25 years, who has held many relevant roles in this profession, I have had personal experience, relevant experience, and historical reference that can highlight the difficulties in chasing performance.
We are seeing this play out in front of our eyes today, as after roughly 13 years of technology and growth stock outperformance, investors are reaching for the stars, forgetting that the rockets they are using to try to get there are already hyper-valued, and value stocks offer superior risk/return prospects.
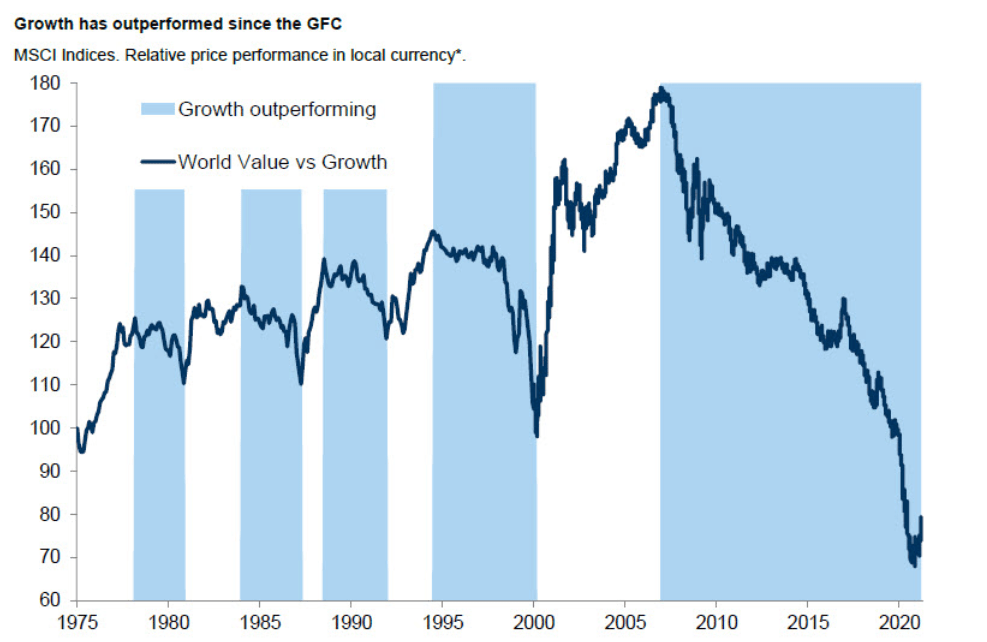
(Source: Nomura)
On this note, remember that Amazon (AMZN), perhaps the greatest growth stock since its May 15th, 1997 IPO, has traded for a price-to-sales multiple of between 1 and 5 for most of its advance the past 13 years.
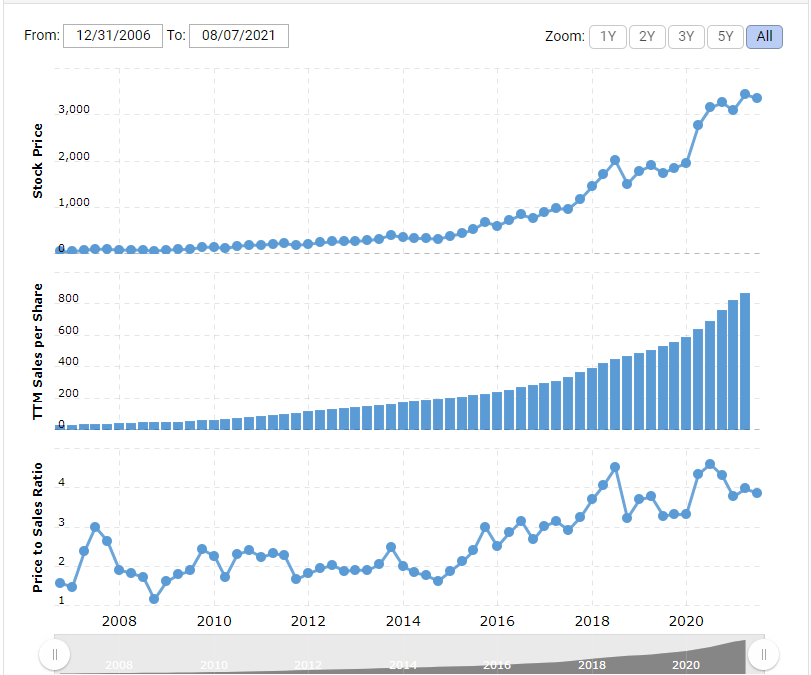 (Source: MacroTrends)
Think about that for a minute, and then consider where the price-to-sales multiples of the top-ten holdings in the ARK Innovation ETF are trading today, which are on average above 20. Adding to the narrative, we can see that these hyper starting valuations did not work already once, in the bubble and fallout from late 1990's euphoria.
Said another way, investors need to look for an alternative road to achieve their goals, and while there is no easy way out, the good news in this regard, is that there is a lot of opportunity.
This is something I wrote about in this recent article, "A Bifurcated Market: Extraordinary Risk And Extraordinary Reward". More specifically, the opportunity is centered in out-of-favor commodity equities, which are still historically undervalued today, but they are not as undervalued as they were last August.
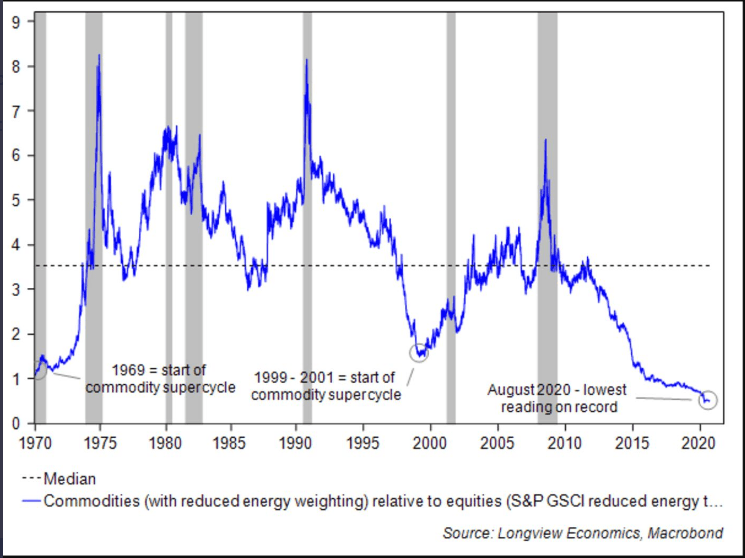
(Source: Longview Economics, Macrobond)
In closing, for much of the past two years, even though the market bottomed in March of 2020, I have been pounding the table on the extremely out-of-favor commodity equities, and I still think we're in the early innings of what will be a longer-term price appreciation. Investors skittish of the commodity sector should research cast aside financials as they also will benefit from rising inflationary expectations and rising long-term interest rates. Understanding the bigger picture, then having an understanding of the bottoms-up fundamentals has been the key to outperformance, and this is a path that has not been easy with those participating confirming this reality. However, the road less taken is sometimes the better one, and I firmly believe that today, as traditional stocks, bonds, and real estate offer very poor starting valuations and very poor projected future real returns from today's price levels. More specifically, the out-of-favor assets and asset classes, including commodities and commodity equities and out-of-favor specific securities are where the historic opportunity has been, and that's where it still stands, from my perspective.
The Contrarian
There is historic opportunity in the investment markets today. I have spent thousands of hours analyzing the markets, looking for the best opportunities, looking to replicate what I have been able to accomplish in the past. From my perspective, the opportunities in targeted out-of-favor equities today are every bit as big as the best opportunities in early 2016, and late 2008/early 2009. For further perspective on these opportunities, consider a membership to The Contrarian, sign up here to join.