Vadzim Kushniarou/iStock via Getty Images
I have long had mixed feelings about ETFs. I am not convinced that most of them make a compelling investment case in the stead of buying individual companies. This is in part due to the simple dynamic of expense ratios: you have to pay someone to manage whatever ETF you buy, and those expenses will drag down your returns. Another reason I shy away from ETFs is because most of them hold too many weak companies that I wouldn't invest a cent in outside an ETF, so why would I settle for an ETF that has that company in it? The third main reason I don't like them is because ETFs have become so prolific that determining which one to buy takes as much work and research as it takes to research individual companies. So I might as well rid myself of the other two disadvantages and buy individual companies.
My feelings in this regard came to fruition in my investigation of the Invesco (Guggenheim at the time) Solar ETF (NYSEARCA:TAN) back in 2017. In short, that ETF had a lot of garbage companies in it, some of them having little to do with the solar energy theme I wanted exposure to. Nor was I interested in paying the .7% expense ratio. So I put together my own "ETF", consisting of a few solar companies that my research revealed had great potential. In an article published in November of 2017 I revealed my seven picks to go head-to-head with TAN. The results have been decidedly in my favor:
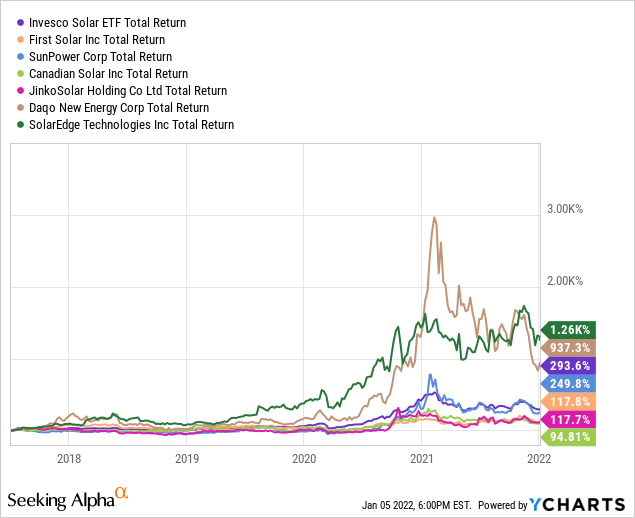
(Note: one of my original seven was 8point3 Energy Partners, which was acquired months after the recommendation. The buyout out price was below what it was when I gave the recommendation. My calculations reflect the loss, with the leftovers then being equally distributed among the remaining six.)
The return on my concentrated portfolio is 406% or ~50% compounded annually whereas TAN has returned 293.6% or ~ 41% compounded annually. Did I get lucky or was my research good? Probably some of both, but I believe my research had a lot to do with it, as I will show later.
Proponents of ETFs argue that it is a simple way to get broad exposure (diversification) to a desired sector, industry, or theme. If you buy an ETF you don't have to worry about selecting winners and avoiding losers. But as I mentioned above, the trouble is that ETFs have become so popular that nowadays there are sometimes dozens of ETFs that are designed to track basically the same thing. Then you are stuck trying to select the ETF that will win and avoid the ETFs that will lose, the very problem investors are hoping to avoid in selecting individual stocks. For example, if you want to have exposure to the video gaming industry via an ETF you have five options to choose from. Those five funds differ enough in so many particulars that researching which one is best for you will require as much work as investigating individual companies for potential purchase.
Now, that's a lot of ruminating. My point with this article is to do a bit of the reverse of what I did with TAN. Instead of picking stocks to outperform an ETF going forward, I want to look at an ETF to see if its past performance delivered returns better than what would have been achieved by trying to pick individual stocks from within that ETF, measured over the same time frame. The ETF under analysis will be the U.S. Global Jets ETF (NYSEARCA:JETS), with a later comparison to TAN. My methodology and observations follow.
Prepare For Take-Off
In my mind, buying an ETF is only worthwhile if it can reasonably be expected to perform better than a handful of individually selected stocks in the same thematic category, and if those individual stocks could be selected without much research. This would provide the benefits of the intended thematic exposure without the baggage that comes in the form of weak companies and an expense ratio.
To put JETS to the test, I am going to go back in time and see if at the beginning of 2014 an investor could have easily selected those air travel related stocks that would end up out-performing (or not) on the basis of a few commonly used, often referred to, and easy to understand metrics. Specifically, the metrics to be tracked are return on invested capital, debt to equity ratio, five-year average revenue growth, and operating margin (four-year average). I feel these select metrics do a good job of providing a snap-shot of how the company has been performing and how well they are set up for the future. Here is the table, showing 2014 data for 11 airlines that made up over 50% of the JETS ETF:
| 2015 stats | ROIC | 5 yr. avg. rev. growth | Debt/Equity | Op. Margin |
| United (UAL) | 8.1% | 18.95% | 4.46 | 5.5% |
| American (AAL) | (-) | 16.45% | 8 | 4.9% |
| Southwest (LUV) | 3.5% | 12.44% | .36 | 7.6% |
| Delta (DAL) | 5.9% | 7.5% | .97 | 7.7% |
| Hawaiian (HA) | 3.1% | 14.36% | 2.43 | 7.2% |
| Air Canada (AC) | (-) | 6.39% | (-) | 3.6% |
| SkyWest (SKYW) | .6% | 10.85% | 1.1 | 3.4% |
| Spirit (SAVE) | 21.7% | 22.5% | .14 | 17.6% |
| JetBlue (JBLU) | 4% | 12% | .78 | 7.85% |
| Allegiant (ALGT) | 17.3% | 15.3% | 1.84 | 14.7% |
| Alaska (ALK) | 9.7% | 9.5% | .32 | 14.1% |
*Data compiled by author using Macroaxis and Morningstar
Looking at this table, which six would you have picked to out-perform? How confident would you have been in your selections?
As measured through the first of January 2020, a few months before COVID-19 shut everything down, here's how they all stacked up:
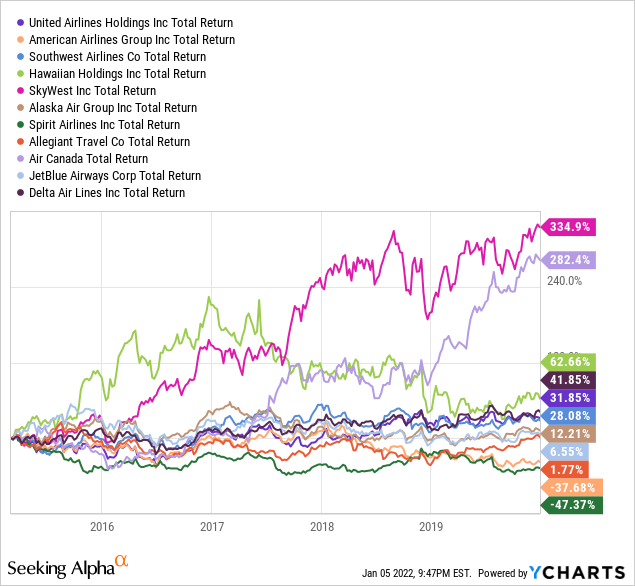
This is in comparison to the 35.73% return on JETS, which got beat by only four of the original eleven companies: SkyWest, Air Canada, Hawaiian, and Delta. Based on the 2014 metrics, I NEVER would have picked Air Canada or SkyWest to crush it. Nor would I have expected Spirit and Allegiant to be so pathetic.
What if we conduct the same exercise with the solar ETF? Were simple metrics from 2016, the most recent full year I looked at when I first researched TAN, sufficient to have predicted winners and losers among 10 stocks that typically have the highest weighting in the solar ETF?
| 2016 | ROIC | 5 yr. rev. growth | Debt/Equity | Op. Margin |
| Xinyi Solar (OTC:XNYIF) | 18% | 43.5% | .76 | 40.6% |
| Hannon Armstrong (HASI) | 2.5% | 79.3% | 1.71 | (REIT) |
| Sunrun (RUN) | 1% | 121% | 1.54 | -47.3% |
| JinkoSolar (JKS) | 17.9% | 23.7% | .08 | 7.7% |
| Canadian Solar (CSIQ) | 4.4% | 8.5% | .7 | 1.9% |
| Daqo (DQ) | 10.1% | 29.6% | .41 | 28.7% |
| SunPower (SPWR) | (-) | 2% | 1.78 | -10% |
| First Solar (FSLR) | (-) | 1.3% | .03 | 10.7% |
| Enphase Energy (ENPH) | (-) | 16.6% | 16 | -18% |
| SolarEdge (SEDG) | 44.3% | 67% | No debt | 14.6% |
*Data compiled by author
Which would you have chosen to win? On these metrics alone, I like the stats of SolarEdge, Daqo, and Xinyi. And how did things turn out? Buying those three in equal weights would have given you a total return of 346%. The return on TAN over the period was 70%.
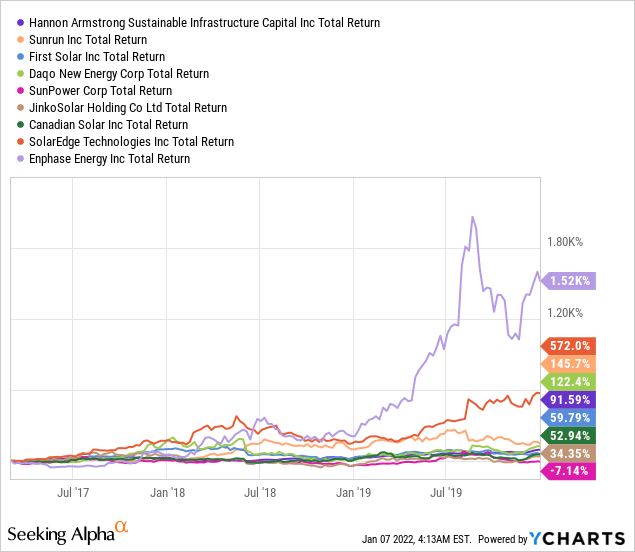
(Xinyi solar wouldn't populate on YCharts, but their return over the period was 346%.)
The big outlier that the metrics didn't suggest was Enphase that absolutely crushed everyone else. But even without Enphase, five of the other nine options would end up beating TAN, and three of those five were the ones with arguably the best metrics in the table above. In other words, beating TAN wouldn't have been too challenging for anyone who took even a cursory look under the hood.
Prepare for Landing
So what's the takeaway? For me, it is that relying on simple metrics to pick winners and losers within an ETF is not a sure bet. It would have worked with TAN but not with JETS. Furthermore, having healthy metrics in one year, when compared to peers, does not mean things will stay that way. Nor do healthy metrics necessarily predict outperformance as it relates to the stock price.
The overarching theme is that how each portfolio is put together matters. The biggest difference between TAN and JETS (apart from them being in completely different sectors) is the methodology behind how each ETF is constructed, which construction has a lot to do with why one is better than the other, in my opinion.
To be included in the JETS ETF, companies have to be an "Airline Company", meaning passenger airlines, aircraft manufacturers, airports, and terminal services companies. The minimum market cap is $100 million, with requirements for liquidity. The ETF is constructed and weighted thusly:
.... each of the four largest U.S. passenger airline companies, as measured primarily by their market capitalization.... receives a 10 percent weighting allocation of the Index. Each of the next eight largest U.S. or Canadian passenger airline companies receives a 3 percent weighting allocation of the Index.
The logic here is that if you are big, you have been reasonably successful in the industry and are on decent competitive and financial footing.
The remaining Airline Companies meeting the Index criteria are then scored based on multiple fundamental factors. Their score is primarily driven by their cash flow return on invested capital (CFROIC) and average dollar value traded with additional inputs based on sales per share growth, gross margins, and sales yield.
On the other hand, to be included in the TAN ETF, the minimum market cap must be $250 million and liquidity must be a 3-month average daily trading volume of $750 million. The only other requirement is that 1/3 of total company revenue must be derived from "solar business activities". Only 1/3. Furthermore, how they define "solar business activities" is quite broad:
Examples of solar business activities include, but are not limited to: (1) solar power equipment producers including ancillary or enabling products such as tracking systems, inverters, batteries, or other solar energy storage systems; (2) suppliers of raw materials, components, or services to solar producers or developers; (3) companies that produce solar equipment fabrication systems; (4) companies involved in solar power system installation, development, integration, maintenance, or finance; (5) companies that produce hydrogen using solar energy; (6) companies that provide solar-powered charging systems for electric vehicles or other electrical devices; (7) companies selling systems that use solar thermal energy to produce heat or electricity, and (8) companies that sell electricity derived from solar power.
This inevitably leads to conditions where investors, in buying the TAN ETF trying to get exposure to the solar theme, end up actually owning companies like Flat Glass Group (OTCPK:FGSGF) that don't have much to do with solar. Yes, they sell photovoltaic glass to panel manufacturers, but they also....
.... offer.... float glass, architectural glass, household glass, and other types of related products. It is also involved in the extraction of a quartzite mine; investment, construction, operation, and maintenance of energy power plants; development of natural gas utilization technology; sale and installation of natural gas pipelines; and exporting of glass products. The company serves PV module manufacturers, glass processing manufacturers, glass wholesalers, furniture manufacturers and processing companies, furniture retailers, architectural contractors, architectural glass processing companies, and construction companies.
(Interestingly, the prospectus for TAN states, "Stocks are ineligible for inclusion in the Underlying Index if the company is engaged in the business of the extraction of coal, petroleum, or natural gas." While Flat Glass is technically in the clear based on the above definition since they only have to do with the transportation of natural gas and not the extraction thereof, I imagine investors would still want to be privy to this information if they have particularly strong green energy leanings.)
That's a whole lot of NOT solar. So many of the other companies in TAN do A LOT of business in hydro and wind power. While companies that have more to do with solar do get a higher weight in the ETF, the amount of non-solar related activities within TAN is significant. Perhaps TAN would be better off labeled as a renewable energy ETF instead of solar.
There are also no quality factors in determining inclusion in or weighting in TAN. A company could be up to their eyeballs in debt with shrinking revenue streams and still end up with a significant weight in the index so long as most of that shrinking revenue is from solar activities. Meyer Burger (MYRBY) technology is one such example. 100% of their revenue comes from solar activities, but they have been cash flow positive in only two of the past ten years, 2016 and 2017, when they had $3 and $13 million of operating cash flow on revenues of $453 and $473 million, respectively. Revenues have been shrinking since then, down to $262 million the year before the pandemic. The long-term chart on Meyer Burger is ugly:
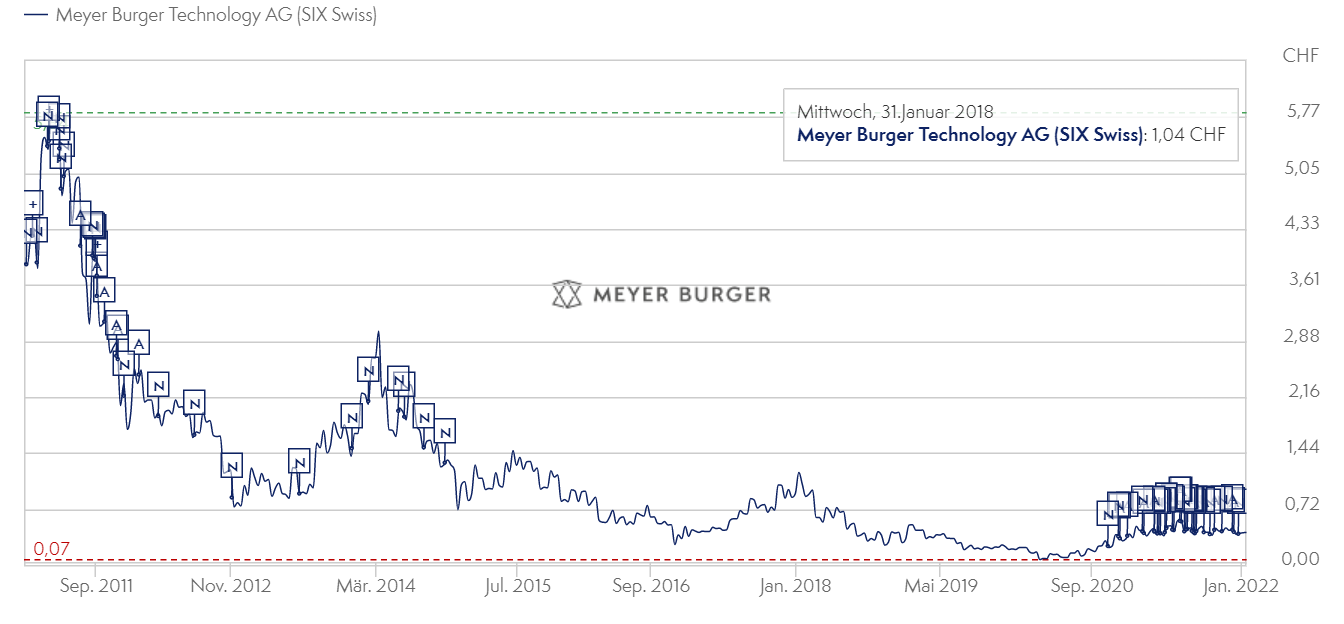
*Image from meyerburger.com
This is the peril of giving little thought to quality when constructing an ETF. To be included in TAN you have to do solar energy things, but you don't have to do them well.
Finally, with 53% of the companies in TAN being outside the U.S., investors must consider exchange rate risk. It can also be difficult to find good information and company documents for small, non-U.S. based companies, making analysis challenging. All of the preceding are risks incurred by all TAN investors and undoubtedly other ETF buyers, whether they know it or not.
Conclusion
The point of this article was to spur thought regarding ETFs and whether or not they are a superior way to invest vs. choosing individual stocks. The answer is, it depends. Not all ETFs are created equal, and the promise of "broad exposure" does not necessarily equate to "good exposure". So much depends on portfolio construction. In my opinion, it takes at least as much work to select the best ETFs as it does to select the best stocks. This relates specifically to peoples trying to "beat the market" and/or who simply enjoy managing a portfolio.
Anyone not trying to beat the market should indeed simply own the market. Extremely low-cost ETFs that track hundreds of companies, such as those offered by Vanguard for the S&P 500 (VOO) or even the total market across all market caps (VTI) are most suitable for those purposes. This is where ETFs shine. But this article doesn't have to do with that.
As it relates specifically to the two ETFs observed today, I think JETS is a great way to get exposure to the air travel industry. It is well constructed and is worth owning due to the historical challenge of picking the "right" specific airline stock that will perform the best. With TAN that isn't at all the case. It is poorly constructed, with weak standards for inclusion as it relates to actually having to do with solar. Furthermore, the absence of any metric that scans for and/or weights towards any semblance of quality means that many investors, likely unbeknownst to them, have their money put into companies that are losing money and have been for a while. This is on top of the .69% expense ratio. You are paying Invesco for underperformance. Think about that, and think twice before trying to use ETFs to beat the market.