Qualitatively Combining '7 Ways To Beat The Market'

Ploutos
20.97K Followers

Summary

  • In an ongoing series, I have described for Seeking Alpha readers equity market factor tilts that have outperformed versus the broad market.
  • This article describes a qualitative approach to thinking through how to combine these factor tilts into a portfolio that further improves performance.
  • These factor tilts produce their outperformance in different parts of the business cycle, and understanding these return patterns can influence portfolio construction.

I have recently published an extensive update of work on Seeking Alpha regarding the long-term outperformance generated by factor tilts - Size, Value, Low Volatility, Dividend Growth, Equal-Weighting, Momentum, and Quality. While some may discount these strategies as backcasting or data mining, I believe there are structural reasons why these strategies have generated outperformance over multiple business cycles.

The most common question I receive from readers is how to combine these factor tilts into a portfolio. There are challenges to publishing a piece on this topic. My readers necessarily have different risk tolerances, investment horizons, and views on the current business cycle. What I am endeavoring to accomplish in this piece - and its companion quantitative piece - is to suggest a framework to readers that can help solve this portfolio construction riddle. I am going to attack this question from two angles - qualitative and quantitative - in two separate, but related, articles.

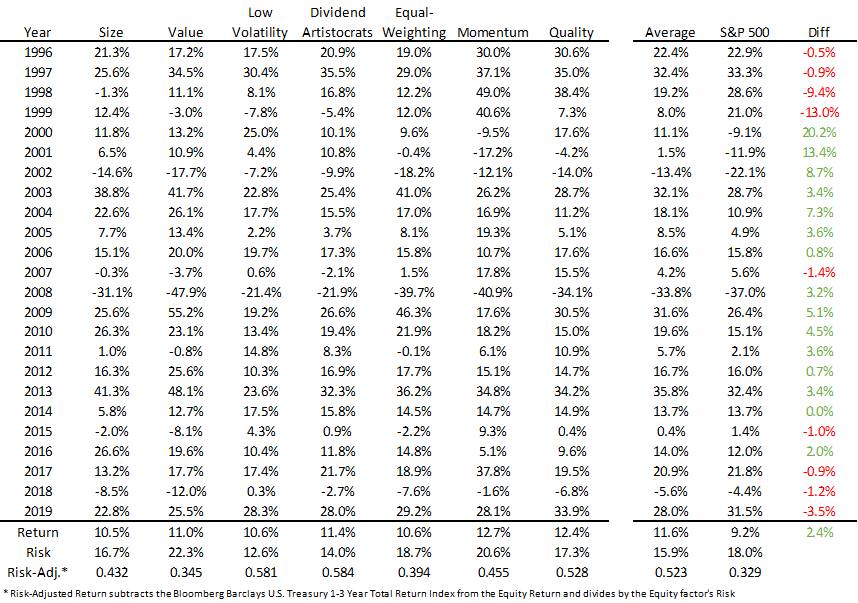
For each of the factor tilts described in my "7 Ways to Beat the Market" series, I have full year total returns dating back to 1996. Longer datasets for these factor tilts are available, but the particular return series for the factor tilts that I am using in this article are replicated by low-cost exchange traded funds, giving readers a ready opportunity to explore these strategies in a cost-effective manner.

All seven of these factor tilts have generated both absolute and risk-adjusted outperformance versus the S&P 500 (SPY) as depicted below:

7 Ways to Beat tbe Market Outperform - Historical Returns

Despite the myriad of numbers above, this piece is the qualitative view. As such, we begin with a pictorial demonstration of when these strategies might be most appropriately deployed over the course of a business cycle. (I am not a gifted artist, so this line below is actually a historical market period with the dates excluded).

This article was written by

20.97K Followers
Institutional investment manager authoring on a variety of topics that pique my interest, and could further discourse in this online community. I hold an MBA from the University of Chicago, and have earned the CFA designation. My articles may contain statements and projections that are forward-looking in nature, and therefore inherently subject to numerous risks, uncertainties and assumptions. While my articles focus on generating long-term risk-adjusted returns, investment decisions necessarily involve the risk of loss of principal. Individual investor circumstances vary significantly, and information gleaned from my articles should be applied to your own unique investment situation, objectives, risk tolerance, and investment horizon.

Analyst’s Disclosure:I am/we are long IJR, RPV, SPLV, NOBL, RSP, SPY.MTUM. I wrote this article myself, and it expresses my own opinions. I am not receiving compensation for it (other than from Seeking Alpha). I have no business relationship with any company whose stock is mentioned in this article.

Seeking Alpha's Disclosure: Past performance is no guarantee of future results. No recommendation or advice is being given as to whether any investment is suitable for a particular investor. Any views or opinions expressed above may not reflect those of Seeking Alpha as a whole. Seeking Alpha is not a licensed securities dealer, broker or US investment adviser or investment bank. Our analysts are third party authors that include both professional investors and individual investors who may not be licensed or certified by any institute or regulatory body.

Recommended For You

About IJR ETF

SymbolLast Price% Chg
Expense Ratio
Div Frequency
Div Rate
Yield
Assets (AUM)
Compare to Peers

More on IJR

Related Stocks

SymbolLast Price% Chg
IJR
--
RSP
--
RPV
--
SPLV
--
SPHQ
--
MTUM
--
NOBL
--